There unfortunately are still a few stumbling blocks toward getting a properly, fully-working virt-manager setup running under WSL2 on Windows 11.
apt install virt-manager just works, of course–but getting WSL2 to properly handle hostnames and SSH key passphrases takes a bit of tweaking.
First up, install a couple of additional packages:
apt install keychain ssh-askpass
The keychain package allows WSL2 to cache the passphrases for your SSH keys, and ssh-askpass allows virt-manager to bump requests up to you when necessary.
If you haven’t already done so, first generate yourself an SSH key and give it a passphrase:
me@my-win11:~# ssh-keygenGenerating public/private rsa key pair.Enter file in which to save the key (~/.ssh/id_rsa):Enter passphrase (empty for no passphrase):Enter same passphrase again:Your identification has been saved in ~/.ssh/id_rsaYour public key has been saved in ~/.ssh/id_rsa.pub
You will also need to configure keychain itself, by adding the following to the end of your .bashrc:
# For Loading the SSH key/usr/bin/keychain -q --nogui $HOME/.ssh/id_rsasource $HOME/.keychain/$HOSTNAME-sh
Now, you’ll enter in your SSH key passphrase each time you open a WSL2 terminal, and it will remember it for SSH sessions opened via that terminal (or via apps opened from that terminal, eg if you type in virt-manager).
If you like to set hostnames in /etc/hosts to make your virt-manager connections look more reasonable, there’s one more step necessary. By default, for some reason WSL2 clobbers /etc/hosts each time it’s started.
You can defang this by creating /etc/wsl.conf and inserting this stanza:
[network]generateHosts = false
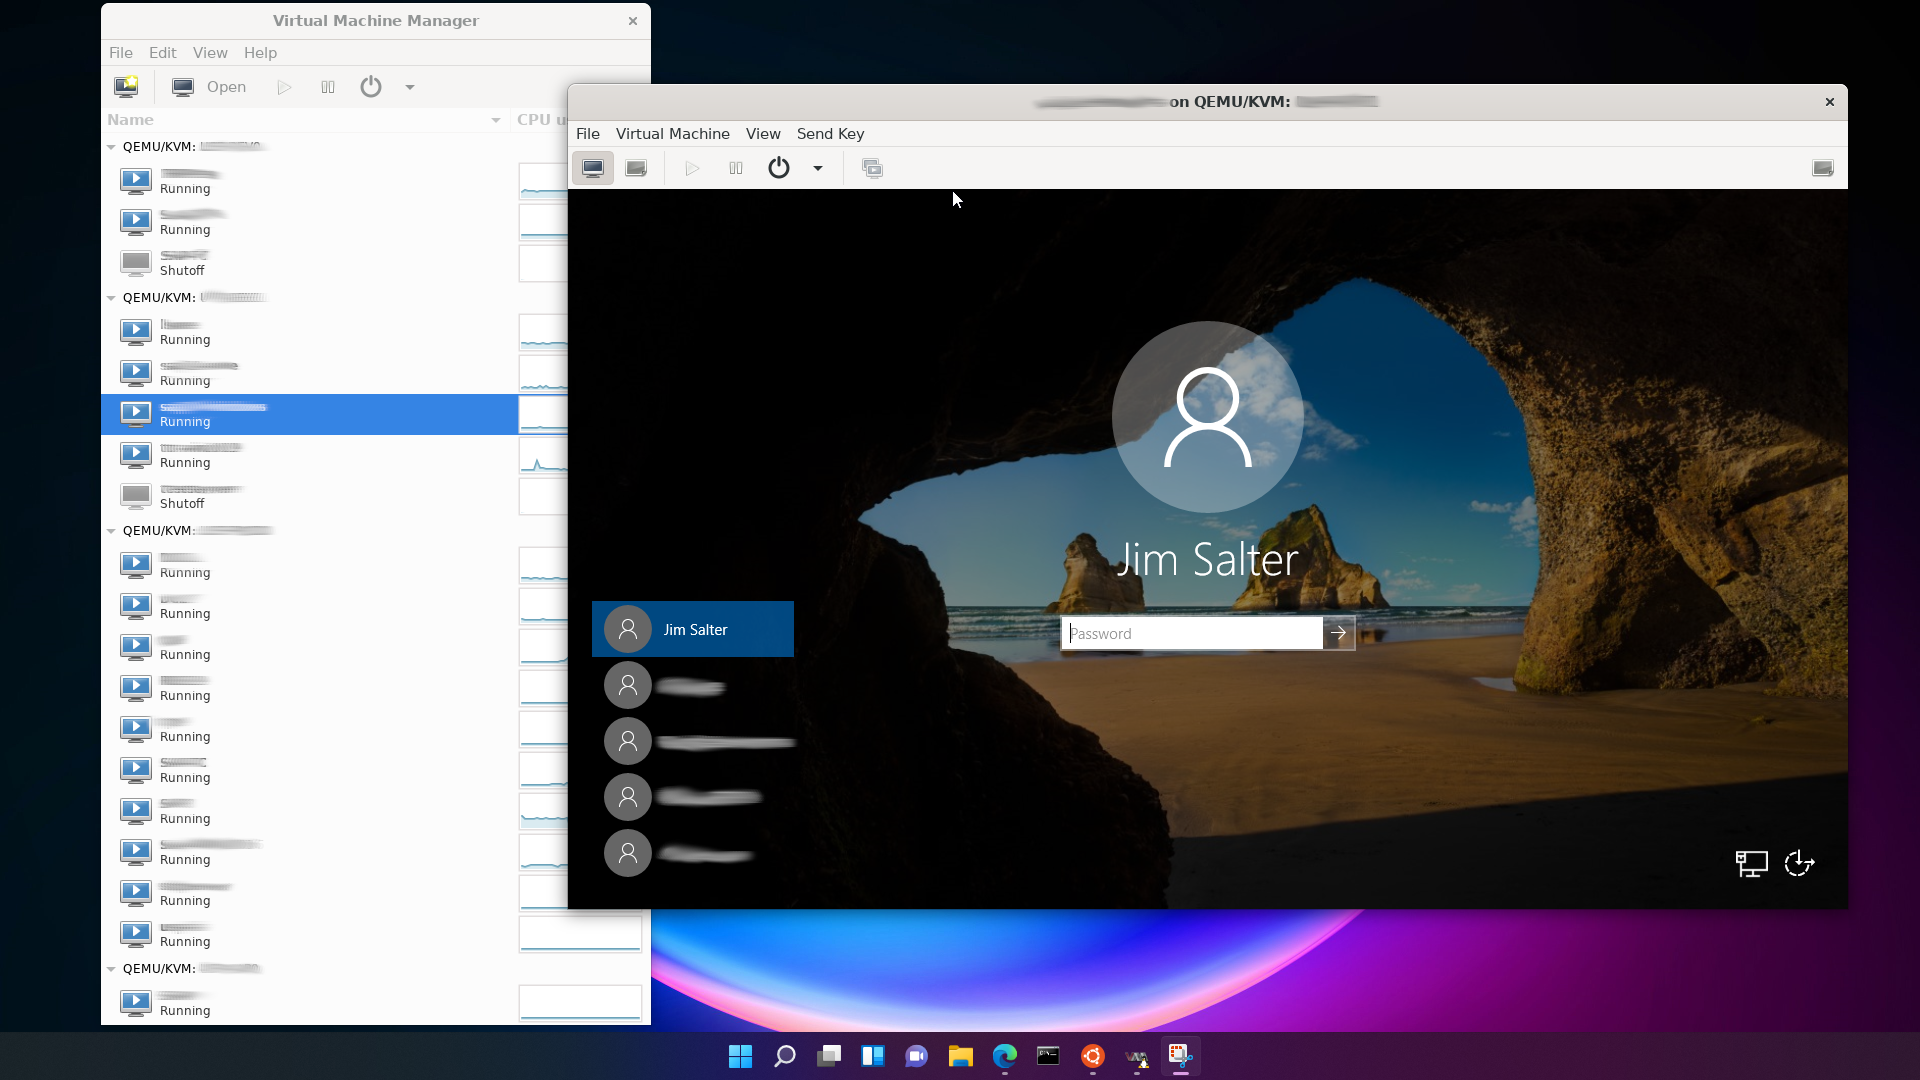
Presto, you can now have a nice, secure, and well-working virt-manager under your Windows 11 WSL2 instance!
One final caveat: I do not recommend trying to create a shortcut in Windows to open virt-manager directly.
You can do that… but if you do, you’re liable to break things badly enough to require a Windows reboot. Windows 11 really doesn’t like launching WSL2 apps directly from a batch file, rather than from within a fully-launched WSL2 terminal!