I recently bought a server which came with Samsung PM1643 SSDs. Trying to install Ubuntu on them didn’t work at first try, because the drives had 520 byte sectors instead of 512 byte.
Luckily, there’s a fix–get the drive(s) to a WORKING Ubuntu system, plug them in, and use the sg_format utility to convert the sector size!
Yep, it’s really that easy. Be warned, this is a destructive, touch-every-sector operation–so it will take a while, and your drives might get a bit warm. The 3.84TB drives I needed to convert took around 10 minutes apiece.
On the plus side, this also fixes any drive slowdowns due to a lack of TRIM, since it’s a destructive sector-level format.
I’ve heard stories of drives that refused to sg_format initially; if you encounter stubborn drives, you might be able to unlock them by dding a gigabyte or so to them–or you might need to first sg_format them with --size=520, then immediately and I mean immediately again with --size=512.
One of the questions that comes up time and time again about ZFS is “how can I migrate my data to a pool on a few of my disks, then add the rest of the disks afterward?”
If you just want to get the data moved and don’t care about balance, you can just copy the data over, then add the new disks and be done with it. But, it won’t be distributed evenly over the vdevs in your pool.
Don’t fret, though, it’s actually pretty easy to rebalance mirrors. In the following example, we’ll assume you’ve got four disks in a RAID array on an old machine, and two disks available to copy the data to in the short term.
Step one: create the new pool, copy data to it
First up, we create a simple temporary zpool with the two available disks.
Simple. Now you’ve got a ZFS mirror named temp, and you can start copying your data to it.
Step two: scrub the pool
Do not skip this step!
zpool scrub temp
Once this is done, do a zpool status temp to make sure you don’t have any errors. Assuming you don’t, you’re ready to proceed.
Step three: break the mirror, create a new pool
zpool detach temp /dev/disk/by-id/disk1
Now, your temp pool is down to one single disk vdev, and you’ve freed up one of its original disks. You’ve also got a known good copy of all your data on disk0, and you’ve verified it’s all good by using a zpool scrub command in step two. So, destroy the old machine’s storage, freeing up its four disks for use.
zpool create tank /dev/disk/by-id/disk1 mirror /dev/disk/by-id/disk2 /dev/disk/by-id/disk3 mirror /dev/disk/by-id/disk4 /dev/disk/by-id/disk5
Now you’ve got your original temporary pool named temp, and a new permanent pool named tank. Pool “temp” is down to one single-disk vdev, and pool “tank” has one single-disk vdev, and two mirror vdevs.
Step four: copy your data from temp to tank
Copy all your data one more time, from the single-disk pool “temp” to the new pool “tank.” You can use zfs replication for this, or just plain old cp or rsync. Your choice.
Step five: scrub tank, destroy temp
Do not skip this step.
zpool scrub tank
Once this is done, do a zpool status tank to make sure you don’t have any errors. Assuming you don’t, now it’s time to destroy your temporary pool to free up its disk.
zpool destroy temp
Almost done!
Step six: attach the final disk from temp to the single-disk vdev in tank
zpool attach tank /dev/disk/by-id/disk0 /dev/disk/by-id/disk1
That’s it—you now have all of your data imported to a six-disk pool of mirrors, and all of the data is evenly distributed (according to disk size, at least) across all vdevs, not all clumped up on the first one to be added.
You can obviously adjust this formula for larger (or smaller!) pools, and it doesn’t necessarily require importing from an older machine—you can use this basic technique to redistribute data across an existing pool of mirrors, too, if you add a new mirror vdev.
The important concept here is the idea of breaking mirror vdevs using zpool detach, and creating mirror vdevs from single-disk vdevs using zpool attach.
You want to reclaim space on a ZFS pool by deleting some old snapshots. Problem is, you take snapshots frequently, so they all have deceptively low REFER values—REFER only shows you the space unique to a snapshot, so it’s entirely possible that deleting two snapshots that each show REFER of 1MiB will actually remove 100GiB of data.
How, you ask? Well, if that 100GiB of data is common to both snapshots, it won’t show up on the REFER of either—but if it was present in only those two snapshots, deleting them both unlinks that 100GiB and marks it free again.
Luckily, zfs destroy has a dry-run option, and can be used to delete sequences of snapshots. So you can see before-hand how much space will be reclaimed by deleting a sequence of snapshots, like this:
root@box:~# zfs destroy -nv pool/dataset@snap4%snap8
would destroy pool/dataset@snap4
would destroy pool/dataset@snap5
would destroy pool/dataset@snap6
would destroy pool/dataset@snap7
would destroy pool/dataset@snap8
would reclaim 25.2G
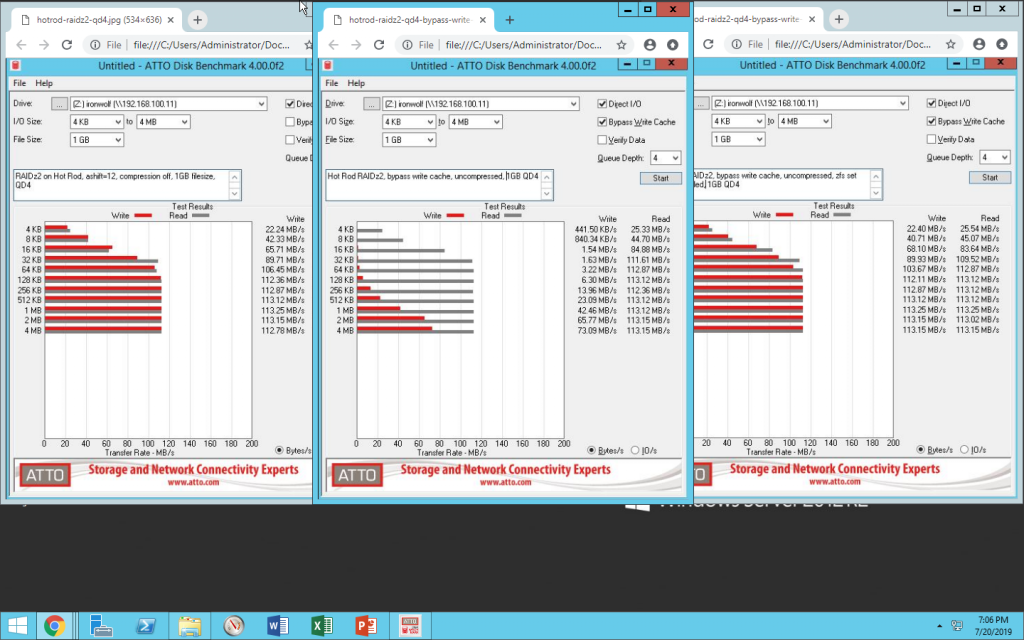
While benchmarking the Ars Technica Hot Rod server build tonight, I decided to empirically demonstrate the effects of zfs set sync=disabled on a dataset.
In technical terms, sync=disabled tells ZFS “when an application requests that you sync() before returning, lie to it.” If you don’t have applications explicitly calling sync(), this doesn’t result in any difference at all. If you do, it tremendously increases write performance… but, remember, it does so by lying to applications that specifically request that a set of data be safely committed to disk before they do anything else. TL;DR: don’t do this unless you’re absolutely sure you don’t give a crap about your applications’ data consistency safeguards!
In the below screenshot, we see ATTO Disk Benchmark run across a gigabit LAN to a Samba share on a RAIDz2 pool of eight Seagate Ironwolf 12TB disks. On the left: write cache is enabled (meaning, no sync() calls). In the center: write cache is disabled (meaning, a sync() call after each block written). On the right: write cache is disabled, but zfs set sync=disabled has been set on the underlying dataset.
L-R: no sync(), sync(), lying in response to sync().
The effect is clear and obvious: zfs set sync=disabled lies to applications that request sync() calls, resulting in the exact same performance as if they’d never called sync() at all.
Finally, after I don’t know HOW many years, I figured out how to get continuously updated stats from iostat that don’t just scroll up the screen and piss you off.
For those of you who aren’t familiar, iostat gives you some really awesome per-disk reports that you can use to look for problems. Eg, on a system I’m moving a bunch of data around on at the moment:
In particular, note that %util column. That lets me see that /dev/sdb is the bottleneck on my current copy operation. (I expect this, since it’s a single disk reading small blocks and writing large blocks to a two-vdev pool, but if this were one big pool, it would be an indication of problems with sdb.)
But what if I want to see a continuously updated feed? Well, I can do iostat –human -xs 1 and get a new listing every second… but it just scrolls up the screen, too fast to read. Yuck.
OK, how about using the watch command instead? Well, normally, when you call iostat, the first output is a reading that averages the stats for all devices since the first boot. This one won’t change visibly very often unless the system was JUST booted, and almost certainly isn’t what you want. It also frustrates the heck out of any attempt to simply use watch.
The key here is the -y argument, which skips that first report which always gives you the summary of history since last boot, and gets straight to the continuous interval reports – and knowing that you need to specify an interval, and a count for iostat output. If you get all that right, you can finally use watch -n 1 to get a running output of iostat that doesn’t scroll up off the screen and drive you insane trying to follow it:
Recently on r/zfs, the topic of ZIL (ZFS Intent Log) and SLOG (Secondary LOG device) came up again. It’s a frequently misunderstood part of the ZFS workflow, and I had to go back and correct some of my own misconceptions about it during the thread. ixSystems has a reasonably good explainer up – with the great advantage that it was apparently error-checked by Matt Ahrens, founding ZFS developer – but it could use a diagram or two to make the workflow clear.
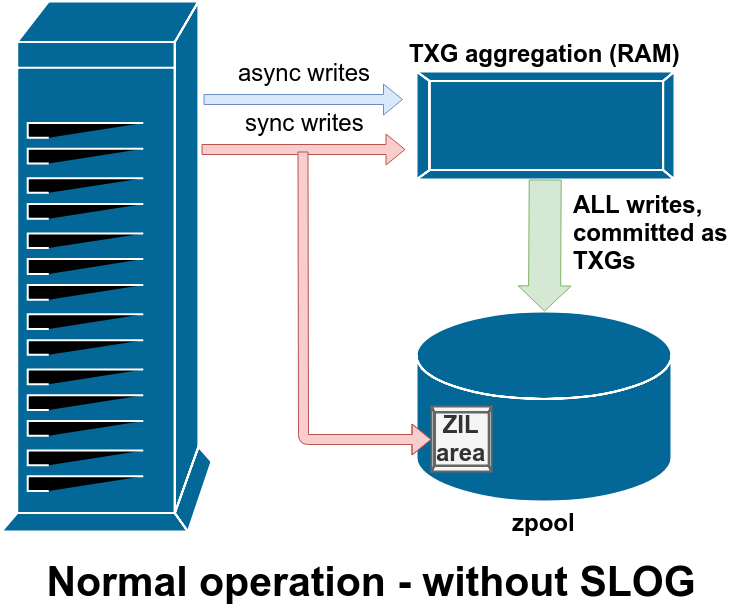
In the normal course of operations on a basic pool with no special devices (such as a SLOG), the write workflow looks like this:
Unless explicitly declared as synchronous (by opening with O_SYNC set, or manually calling sync()), all writes are asynchronous. And – here’s the bit I find most people misunderstand – all writes, including synchronous writes, are aggregated in RAM and committed to the pool in TXGs (Transaction Groups) on a regular basis.
The difference with sync writes is, they’re also written to a special area of the pool called the ZIL – ZFS Intent Log – in parallel with writing them to the aggregator in RAM. This doesn’t mean the sync writes are actually committed to main storage immediately; it just means they’re buffered on-disk in a way that will survive a crash if necessary. The other key difference is that any asynchronous write operation returns immediately; but sync() calls don’t return until they’ve been committed to disk in the ZIL.
I want you to go back and look at that diagram again, though, and notice that there’s no arrow coming out of the ZIL. That’s not a bug – in normal operation, blocks written to the ZIL are never read from again; the sync writes still get committed to the main pool in TXGs from RAM alongside the async writes. The sync write blocks in the ZIL get unlinked after the copies of them in RAM get written out to the pool in TXGs.
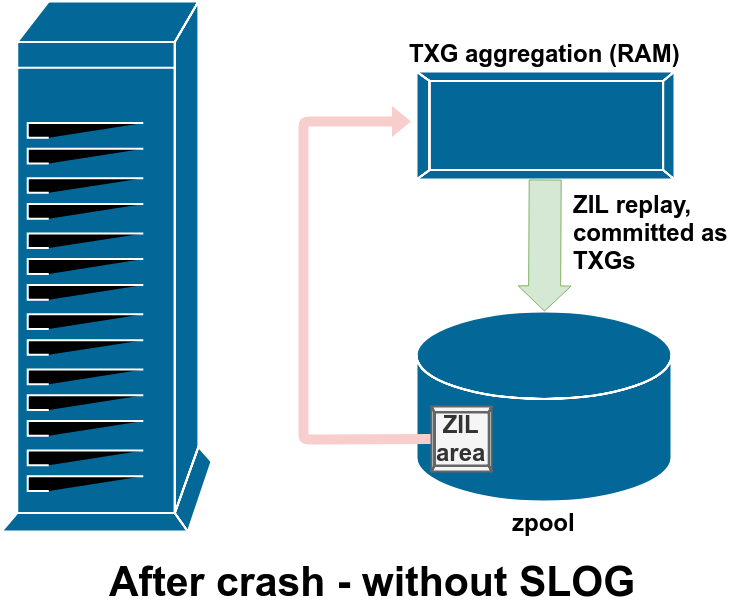
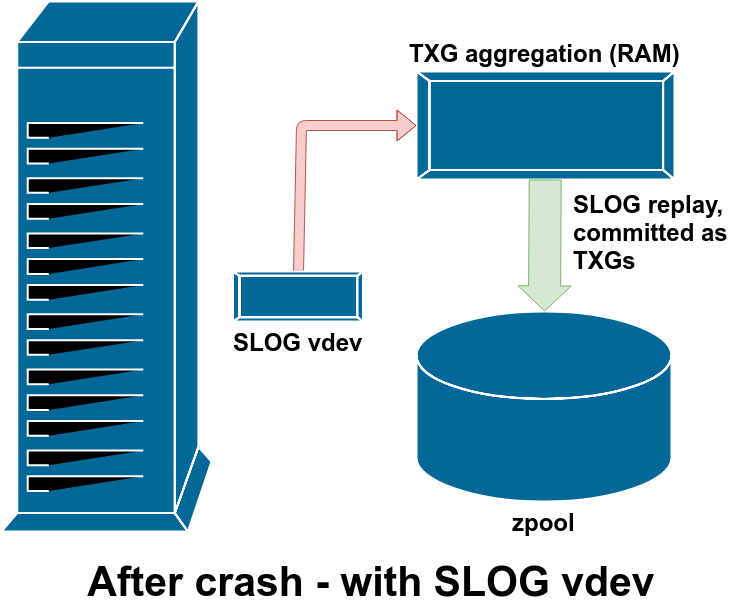
During the import process for a zpool, ZFS checks the ZIL for any dirty writes. If it finds some (due to a kernel crash or system power event), it will replay them from the ZIL, aggregating them into TXG(s), and committing the TXG(s) to the pool as normal. Once the dirty writes from the ZIL have been committed and the ZIL itself cleared, the pool import can proceed normally and we’re back to diagram 1, normal operation.
Why would we want a SLOG?
While normal operation with the ZIL works very reliably, it introduces a couple of pretty serious performance drawbacks. With any filesystem, writing small groups of blocks to disk immediately without benefit of aggregation and ordering introduces serious IOPS (I/O Operations per Second) penalties.
With most filesystems, sync writes also introduce severe fragmentation penalties for any future reads of that data. ZFS avoids the increased future fragmentation penalty by writing the sync blocks out to disk as though they’d been asynchronous to begin with. While this avoids the future read fragmentation, it introduces a write amplification penalty at the time of committing the writes; small writes must be written out twice (once to ZIL and then again later in TXGs to main storage).
Larger writes avoid some of this write amplification by committing the blocks directly to main storage, committing a pointer to those blocks to the ZIL, and then only needing to update the pointer when writing out the permanent TXG later. This is pretty effective at minimizing the write throughput amplification, but doesn’t do much to mitigate write IOPS amplification – and, please repeat with me, most storage workloads bind on IOPS.
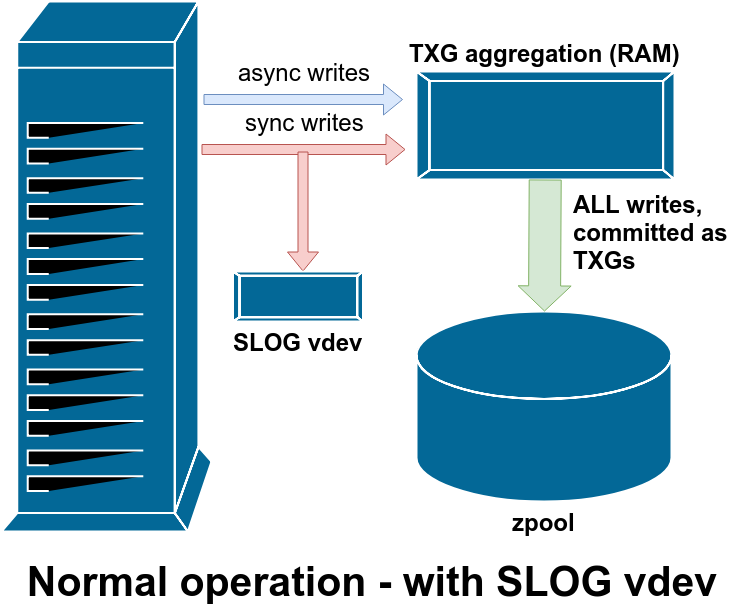
So if your system experiences a lot of sync write operations, a SLOG – Secondary LOG device – can help. The SLOG is a special standalone vdev that takes the place of the ZIL. It performs exactly like the ZIL, it just happens to be on a separate, isolated device – which means that “double writes” due to sync don’t consume the IOPS or throughput of the main storage itself. This also means the latency of the sync write operations themselves improves, since the call to sync() doesn’t return until after the data has been committed temporarily to disk – in this case, to the SLOG, which should be nice and idle in comparison with our busy main storage vdevs.
Ideally, your SLOG device should also be extremely fast, with tons of IOPS – read “fast solid state drive” – to get that sync write latency down as low as possible. However, the only speed we care about here is write speed; the SLOG, just like the ZIL, is never read from at all during normal operation. It also doesn’t need to be very large – just enough to hold a few seconds’ worth of writes. Remember, every time ZFS commits TXGs to the pool, it unlinks whatever’s in the SLOG/ZIL!
Pictured above is the only time the SLOG gets read from – after a crash, just like the ZIL. There really is zero difference between SLOG and ZIL, apart from the SLOG being separate from the main pool vdevs in order to conserve write throughput and IOPS, and minimize sync write latency.
Should I set sync=always with a fast SLOG?
Yes, you canzfs set sync=always to force all writes to a given dataset or zvol to be committed to the SLOG. But it won’t make your asynchronous writes go any faster. Remember, asynchronous write calls already return immediately – you literally can’t improve on that, no matter what you do.
You also can’t materially improve throughput, since the SLOG is only going to buffer a few seconds of writes before main commits to the pool via TXGs from RAM kick in.
The potential benefit to setting zfs sync=always isn’t speed, it’s safety.
If you’ve got applications that notoriously write unsafely and tend to screw themselves after a power outage or other crash – eg any databases using myISAM or other non-journalling storage engine – you might decide to set zfs sync=always on the dataset or zvol containing their back ends, to make certain that you don’t end up with a corrupt db after a crash. Again, you’re not going faster, you’re going safer.
OK, what about sync=disabled?
No matter how fast a SLOG you add, setting sync=always won’t make anything go faster. Setting sync=disabled, on the other hand, will definitely speed up any workload with a lot of synchronous writes.
sync=disabled decreases latency at the expense of safety.
If you have an application that calls sync() (or opens O_SYNC) far too often for your tastes and you think it’s just a nervous nelly, setting sync=disabled forces its synchronous writes to be handled as asynchronous, eliminating any double write penalty (with only ZIL) or added latency waiting for on-disk commits. But you’d better know exactly what you’re doing – and be willing to cheerfully say “welp, that one’s on me” if you have a kernel crash or power failure, and your application comes back with corrupt data due to missing writes that it had depended on being already committed to disk.
ZFS stores data in records—also known as, and interchangeably referred to by OpenZFS devs as blocks—which are themselves composed of on-disk sectors. The physical sector size on disk is set by the ashift value at time of vdev creation, and is immutable. The recordsize, on the other hand, is individual to each dataset(although it can be inherited from parent datasets), and can be changed at any time you like. In 2019, recordsize defaults to 128K if not explicitly set.
big files? big recordsize.
The general rule of recordsize is that it should closely match the typical workload experienced within that dataset. For example, a dataset used to store high-quality JPGs, averaging 5MB or more, should have recordsize=1M. This matches the typical I/O seen in that dataset – either reading or writing a full 5+ MB JPG, with no random access within each file – quite well; setting that larger recordsize prevents the files from becoming unduly fragmented, ensuring the fewest IOPS are consumed during either read or write of the data within that dataset.
DB binaries? Smaller recordsize.
By contrast, a dataset which directly contains a MySQL InnoDB database should have recordsize=16K. That’s because InnoDB defaults to a 16KB page size, so most operations on an InnoDB database will be done in individual 16K chunks of data. Matching recordsize to MySQL’s page size here means we maximize the available IOPS, while minimizing latency on the highly sync()hronous reads and writes made by the database (since we don’t need to read or write extraneous data while handling our MySQL pages).
VMs? Match the recordsize to the VM storage format.
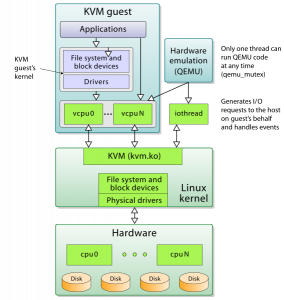
(That’s cluster_size, for QEMU/KVM .qcow2.)
On the other hand, if you’ve got a MySQL InnoDB database stored within a VM, your optimal recordsize won’t necessarily be either of the above – for example, KVM .qcow2 files default to a cluster_size of 64KB. If you’ve set up a VM on .qcow2 with default cluster_size, you don’t want to set recordsize any lower (or higher!) than the cluster_size of the .qcow2 file. So in this case, you’ll want recordsize=64K to match the .qcow2’s cluster_size=64K, even though the InnoDB database inside the VM is probably using smaller pages.
An advanced administrator might look at all of this, determine that a VM’s primary function in life is to run MySQL, that MySQL’s default page size is good, and therefore set both the .qcow2 cluster_sizeand the dataset’s recordsize to match, at 16K each.
A different administrator might look at all this, determine that the performance of MySQL in the VM with all the relevant settings left to their defaults was perfectly fine, and elect not to hand-tune all this crap at all. And that’s okay.
What if I set recordsize too high?
If recordsize is much higher than the size of the typical storage operation within the dataset, latency will be greatly increased and this is likely to be incredibly frustrating. IOPS will be very limited, databases will perform poorly, desktop UI will be glacial, etc.
What if I set recordsize too low?
If recordsize is a lot smaller than the size of the typical storage operation within the dataset, fragmentation will be greatly (and unnecessarily) increased, leading to unnecessary performance problems down the road. IOPS as measured by artificial tools will be super high, but performance profiles will be limited to those presented by random I/O at the record size you’ve set, which in turn can be significantly worse than the performance profile of larger block operations.
You’ll also screw up compression with an unnecessarily low recordsize; zfs inline compression dictionaries are per-record, and work by fitting the contents of a single logical record (aka block) into fewer on-disk sectors than it would have needed if uncompressed.
If you set compression=lz4, ashift=12, and recordsize=4K you’ll effectively have NO compression, because your sector size is equal to your recordsize—and you can’t store data in “half a sector”, so compressing a one-sector record down to 0.5 sectors’ worth of data would not result in less usage of on-disk capacity.
Meanwhile, the same dataset with the default 128K recordsize might easily have a 1.7:1 compression ratio.
Are the defaults good? Do I aim high, or do I aim low?
128K is a pretty reasonable “ah, what the heck, it works well enough” setting in general. It penalizes you significantly on IOPS and latency for small random I/O operations, and it presents more fragmentation than necessary for large contiguous files, but it’s not horrible at either task. There is a lot to be gained from tuning recordsize more appropriately for task, though.
What about bittorrent?
The “big records for big files” rule of thumb still applies for datasets used as bittorrent targets.
This is one of those cases where things work just the opposite of how you might think – torrents write data in relatively small chunks, and access them randomly for both read and write, so you might reasonably think this calls for a small recordsize. However, the actual data in the torrents is typically huge files, which are accessed in their entirety for everything but the initial bittorrent session.
Since the typical access pattern is “large-file”, most people will be better off using recordsize=1M in the torrent target storage. This keeps the downloaded data unfragmented despite the bittorrent client’s insanely random writing patterns. The data acquired during the bittorrent session in chunks is accumulated in the ZIL until a full record is available to write, since the torrent client itself is not synchronous – it writes all the time, but rarely if ever calls sync().
As a proof-of-concept, I used the Transmission client on an Ubuntu 16.04 LTS workstation to download the Ubuntu 18.04.2 Server LTS ISO, with a dataset using recordsize=1M as the target. This workstation has a pool consisting of two mirror vdevs on rust, so high levels of fragmentation would be very easy to spot.
Exporting the pool and unloading the ZFS kernel module entirely is a weapons-grade-certain method of emptying the ARC entirely; getting better than 200 MB/sec average read throughput directly from the rust vdevs afterward (the transfer actually peaked at nearly 400 MB/sec!) confirms that our torrented ISO is not fragmented.
Note that preallocation settings in your bittorrent client are meaningless when the client is saving to ZFS – you can’t actually preallocate in any meaningful way on ZFS, because it’s a copy-on-write filesystem.
In an earlier post, I demonstrated why you shouldn’t mix rust and SSDs – reads on your pool bind at the speed of the slowest vdev; effectively making SSDs in a pool containing rust little more than extremely small, expensive rust disks themselves. That post was a follow-up to an even earlier post demonstrating that – as of 0.6.x – ZFS did not allocate writes to the lowest latency vdev.
An update to the Storage Pool Allocator (SPA) has changed the original write behavior; as of 0.7.0 (and Ubuntu Bionic includes 0.7.5) writes really are allocated to the lowest-latency vdev in the pool. To test this, I created a throwaway pool on a system with both rust and SSD devices on board. This isn’t the cleanest test possible – the vdevs are actually sparse files created on, respectively, an SSD mdraid1 and another pool consisting of on rust mirror vdev. It’s good enough for government work, though, so let’s see how small-block random write operations are allocated when you’ve got one rust vdev and one SSD vdev:
root@demo0:/tmp# zpool create -oashift=12 test /tmp/rust.bin /tmp/ssd.bin
root@demo0:/tmp# zfs set compression=off test

root@demo0:/tmp# fio --name=write --ioengine=sync --rw=randwrite \
--bs=16K --size=1G --numjobs=1 --end_fsync=1

[...]

Run status group 0 (all jobs):
WRITE: bw=204MiB/s (214MB/s), 204MiB/s-204MiB/s (214MB/s-214MB/s),
io=1024MiB (1074MB), run=5012-5012msec

root@demo0:/tmp# du -h /tmp/ssd.bin ; du -h /tmp/rust.bin
1.8M /tmp/ssd.bin
237K /tmp/rust.bin
Couldn’t be much clearer – 204 MB/sec is higher throughput than a single rust mirror can manage for 16K random writes, and almost 90% of the write operations were committed to the SSD side. So the SPA updates in 0.7.0 work as intended – when pushed to the limit, ZFS will now allocate far more of its writes to the fastest vdevs available in the pool.
I italicized that for a reason, of course. When you don’t push ZFS hard with synchronous, small-block writes like we did with fio above, it still allocates according to free space available. To demonstrate this, we’ll destroy and recreate our hybrid test pool – and this time, we’ll write a GB or so of random data sequentially and asynchronously, using openssl to rapidly generate pseudo-random data, which we’ll pipe through pv into a file on our pool.
Although we wrote our pseudorandom data very rapidly to the pool, in this case we did so sequentially and asynchronously, rather than in small random access blocks and synchronously. And in this case, our writes were committed near-equally to each vdev, despite one being immensely faster than the other.
Please note that this describes the SPA’s behavior when allocating writes at the pool level – it has nothing at all to do with the behavior of individual vdevs which have both rust and SSD member devices. My recent test of half-rust/half-SSD mirror vdevs was also run on Bionic with ZFS 0.7.5, and demonstrated conclusively that even read behavior inside a vdev doesn’t favor lower-latency devices, let alone write behavior.
The new SPA code is great, and it absolutely does improve write performance on IOPS-saturated pools. However, it is not intended to enable the undying dream of mixing rust and SSD storage willy-nilly, and if you try to do so anyway, you’re gonna have a bad time.
I still do not recommend mixing SSDs and rust in the same pool, or in the same vdev.
Quick and dirty cheat sheet for anyone getting ready to set up a new ZFS pool. Here are all the settings you’ll want to think about, and the values I think you’ll probably want to use.
I am not generally a fan of tuning things unless you need to, but unfortunately a lot of the ZFS defaults aren’t optimal for most workloads.
SLOG and L2ARC are special devices, not parameters… but I included them anyway. Lean into it.
parameter
best* value
why / what does it do?
ashift
12
Ashift tells ZFS what the underlying physical block size your disks use is. It’s in bits, so ashift=9 means 512B sectors (used by all ancient drives), ashift=12 means 4K sectors (used by most modern hard drives), and ashift=13 means 8K sectors (used by some modern SSDs).
If you get this wrong, you want to get it wrong high. Too low an ashift value will cripple your performance. Too high an ashift value won’t have much impact on almost any normal workload.
Ashift isper vdev, and immutable once set. This means you should manually set it at pool creation, and any time you add a vdev to an existing pool, and should never get it wrong because if you do, it will screw up your entire pool and cannot be fixed.
xattr
sa
Sets Linux eXtended ATTRibutes directly in the inodes, rather than as tiny little files in special hidden folders.
This can have a significant performance impact on datasets with lots of files in them, particularly if SELinux is in play. Unlikely to make any difference on datasets with very few, extremely large files (eg VM images).
compression
lz4
Compression defaults to off, and that’s a losing default value. Even if your data is incompressible, your slack space is (highly) compressible.
LZ4 compression is faster than storage. Yes, really. Even if you have a $50 tinkertoy CPU and a blazing-fast SSD. Yes, really. I’ve tested it. It’s a win.
You might consider gzip compression for datasets with highly compressible files. It will have better compression rate but likely lower throughput. YMMV, caveat imperator.
atime
off
If atime is on – which it is by default – your system has to update the “Accessed” attribute of every file every time you look at it. This can easily double the IOPS load on a system all by itself.
Do you care when the last time somebody opened a given file was, or the last time they ls’d a directory? Probably not. Turn this off.
recordsize
64K
If you have files that will be read from or written to in random batches regularly, you want to match the recordsize to the size of the reads or writes you’re going to be digging out of / cramming into those large files.
For most database binaries or VM images, 64K is going to be either an exact match to the VM’s back end storage cluster size (eg the default cluster_size=64K on QEMU’s QCOW2 storage) or at least a better one than the default recordsize, 128K.
If you’ve got a workload that wants even smaller blocks—for example, 16KiB to match MySQL InnoDB or 8KiB to match PostgreSQL back-ends—you should tune both ZFS recordsize and the VM back end storage (where applicable) to match.
This can improve the IOPS capability of an array used for db binaries or VM images fourfold or more.
recordsize
1M
Wait, didn’t we just do recordsize…? Well, yes, but different workloads call for different settings if you’re tuning.
If you’re only reading and writing in fairly large chunks – for example, a collection of 5-8MB JPEG images from a camera, or 100GB movie files, either of which will not be read or written random access – you’ll want to set recordsize=1M, to reduce the IOPS load on the system by requiring fewer individual records for the same amount of data. This can also increase compression ratio, for compressible data, since each record uses its own individual compression dictionary.
If you’re using bittorrent, recordsize=16K results in higher possible bittorrent write performance… but recordsize=1M results in lower overall fragmentation, and much better performance when reading the files you’ve acquired by torrent later.
SLOG
maybe
SLOG isn’t a setting, it’s a special vdev type that acts as a write aggregation layer for the entire pool. It only affects synchronous writes – asynchronous writes are already aggregated in the ZIL in RAM.
SLOG doesn’t need to be a large device; it only has to accumulate a few seconds’ worth of writes… but if you’re using NAND flash, it probably should be a large device, since write endurance is proportional to device size. On systems that need a LOG vdev in the first place, that LOG vdev will generally get an awful lot of writes.
Having a LOG vdev means that synchronous writes perform like asynchronous writes; it doesn’t really act like a “write cache” in the way new ZFS users tend to hope it will.
Great for databases, NFS exports, or anything else that calls sync() a lot. Not too useful for more casual workloads.
L2ARC
nope!
L2ARC is a layer of ARC that resides on fast storage rather than in RAM. It sounds amazing – super huge super fast read cache!
Yeah, it’s not really like that. For one thing, L2ARC is ephemeral – data in L2ARC doesn’t survive reboots. For another thing, it costs a significant amount of RAM to index the L2ARC, which means now you have a smaller ARC due to the need for indexing your L2ARC.
Even the very fastest SSD is a couple orders of magnitude slower than RAM. When you have to go to L2ARC to fetch data that would have fit in the ARC if it hadn’t been for needing to index the L2ARC, it’s a massive lose.
Most people won’t see any real difference at all after adding L2ARC. A significant number of people will see performance decrease after adding L2ARC. There is such a thing as a workload that benefits from L2ARC… but you don’t have it. (Think hundreds of users, each with extremely large, extremely hot datasets.)
* “best” is always debatable. Read reasoning before applying. No warranties offered, explicit or implied.
In an earlier post, I addressed the never-ending urban legend that ZFS writes data to the lowest-latency vdev. Now the urban legend that never dies has reared its head again; this time with someone claiming that ZFS will issue read operations to the lowest-latency disk in a given mirror vdev.
TL;DR – this, too, is a myth. If you need or want an empirical demonstration, read on.
I’ve got an Ubuntu Bionic machine handy with both rust and SSD available; /tmp is an ext4 filesystem on an mdraid1 SSD mirror and /rust is an ext4 filesystem on a single WD 4TB black disk. Let’s play.
Now we’ve got a pool that is rust only… but we’ve got an ssd vdev off to the side, ready to attach. Let’s run an fio test on our rust-only pool first. Note: since this is read testing, we’re going to throw away our first result set; they’ll largely be served from ARC and that’s not what we’re trying to do here.
OK, cool. Now that fio has generated its dataset, we’ll clear all caches by exporting the pool, then clearing the kernel page cache, then importing the pool again.
root@box:/test# cd ~
root@box:~# zpool export test
root@box:~# echo 3 > /proc/sys/vm/drop_caches
root@box:~# zpool import -d /tmp/disks test
root@box:~# cd /test
Now we can get our first real, uncached read from our rust-only pool. It’s not terribly pretty; this is going to take 5 minutes or so.
root@box:/test# fio --name=read --ioengine=sync  --rw=randread --bs=16K --size=1G --numjobs=1 --end_fsync=1
[ ... ]
Run status group 0 (all jobs):
  READ: bw=17.6MiB/s (18.5MB/s), 17.6MiB/s-17.6MiB/s (18.5MB/s-18.5MB/s), io=1024MiB (1074MB), run=58029-58029msec
Alright. Now let’s attach our ssd and make this a mirror vdev, with one rust and one SSD disk.
root@box:/test# zpool attach test /tmp/disks/rust.bin /tmp/disks/ssd.bin
root@box:/test# zpool status test
  pool: test
 state: ONLINE
  scan: resilvered 1.00G in 0h0m with 0 errors on Sat Jul 14 14:34:07 2018
config:

    NAME                     STATE     READ WRITE CKSUM
    test                     ONLINE       0     0     0
      mirror-0               ONLINE       0     0     0
        /tmp/disks/rust.bin  ONLINE       0     0     0
        /tmp/disks/ssd.bin   ONLINE       0     0     0

errors: No known data errors
Cool. Now that we have one rust and one SSD device in a mirror vdev, let’s export the pool, drop all the kernel page cache, and reimport the pool again.
root@box:/test# cd ~
root@box:~# zpool export test
root@box:~# echo 3 > /proc/sys/vm/drop_caches
root@box:~# zpool import -d /tmp/disks test
root@box:~# cd /test
Gravy. Now, do we see massively improved throughput when we run the same fio test? If ZFS favors the SSD, we should see enormously improved results. If ZFS does not favor the SSD, we’ll not-quite-doubled results.
root@box:/test# fio --name=read --ioengine=sync  --rw=randread --bs=16K --size=1G --numjobs=1 --end_fsync=1
[...]
Run status group 0 (all jobs):
   READ: bw=31.1MiB/s (32.6MB/s), 31.1MiB/s-31.1MiB/s (32.6MB/s-32.6MB/s), io=1024MiB (1074MB), run=32977-32977msec
Welp. There you have it. Not-quite-doubled throughput, matching half – but only half – of the read ops coming from the SSD. To confirm, we’ll do this one more time; but this time we’ll detach the rust disk and run fio with nothing in the pool but the SSD.
root@box:/test# cd ~
root@box:~# zpool detach test /tmp/disks/rust.bin
root@box:~# zpool export test
root@box:~# zpool import -d /tmp/disks test
root@box:~# cd /test
Moment of truth… this time, fio runs on pure solid state:
root@box:/test# fio --name=read --ioengine=sync  --rw=randread --bs=16K --size=1G --numjobs=1 --end_fsync=1
[...]
Run status group 0 (all jobs):
  READ: bw=153MiB/s (160MB/s), 153MiB/s-153MiB/s (160MB/s-160MB/s), io=1024MiB (1074MB), run=6710-6710msec