You buy a nice new firewall appliance. You install OpnSense on it, set all the WAN and LAN stuff up to match your existing firewall, and you drop it into place. WTF, no internet…?
First of all, if you’re using a cable ISP, remember that most cable modems are MAC address locked, and will refuse to talk to a new MAC address if they’ve already seen a different one connected. So, remember to FULLY power-cycle your cable modem. Buttons won’t cut it, in many cases—you gotta unplug the power cable out of that sucker, give it a count of five to think about its sins, then plug it back in and let it re-sync.
If you still don’t have any internets after power-cycling and your modem showing everything sync’ed and online, you may be falling afoul of a weirdness in OpnSense’s default gateway configs. By default, it will mark a gateway as “down” if it doesn’t return pings… but many ISP gateway addresses (not the WAN address your router gets, the one just upstream of it) don’t return pings. So, OpnSense reports it as down and refuses to even try slinging packets through it.
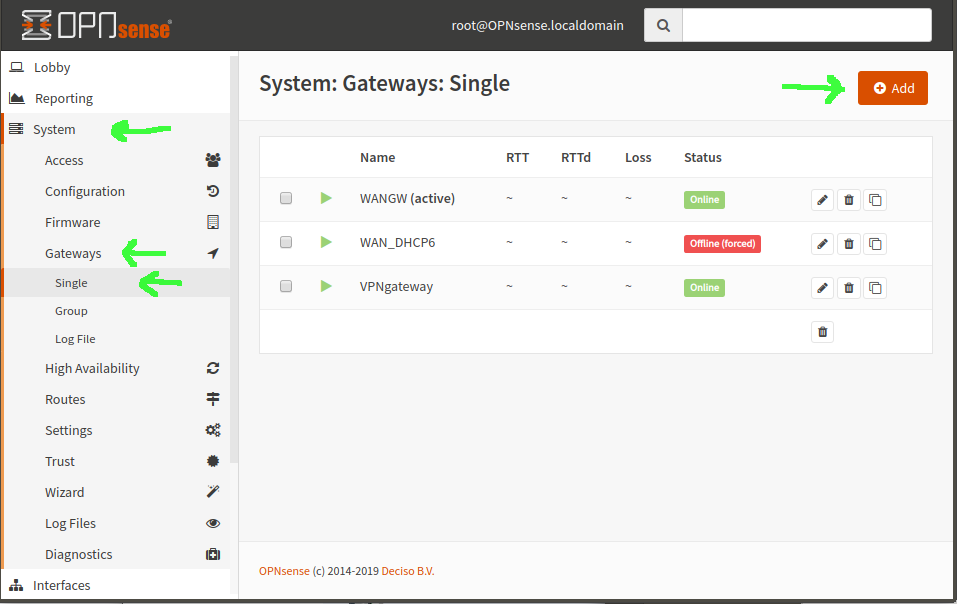
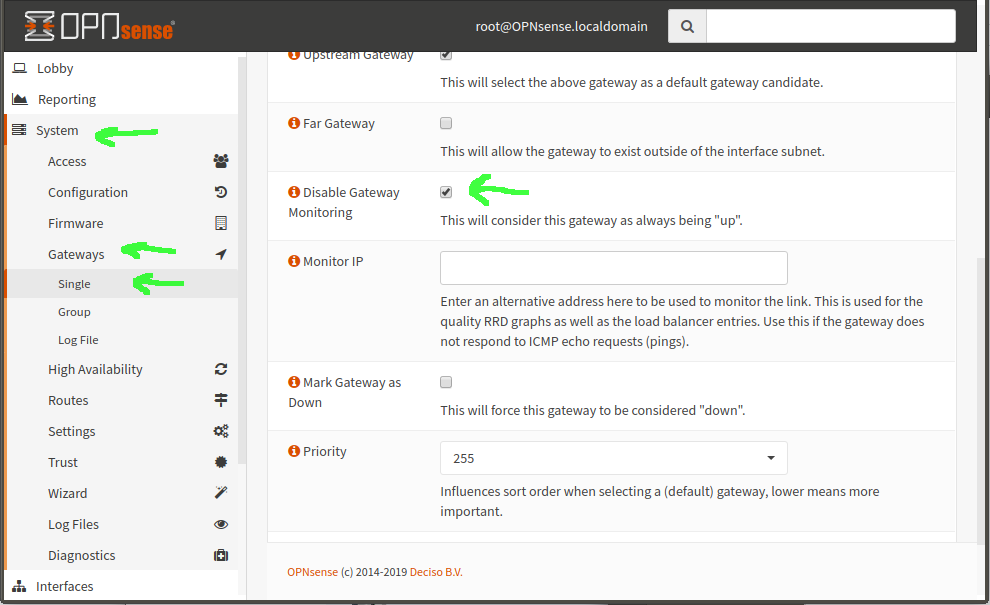
To fix this, go to System–>Gateways–>Single and select your WANGW gateway for editing. Now scroll down, find “Disable Gateway monitoring” and give that sucker a checkmark. Once you click “Save”, you should now see your gateway green and online, and packets should start flowing.
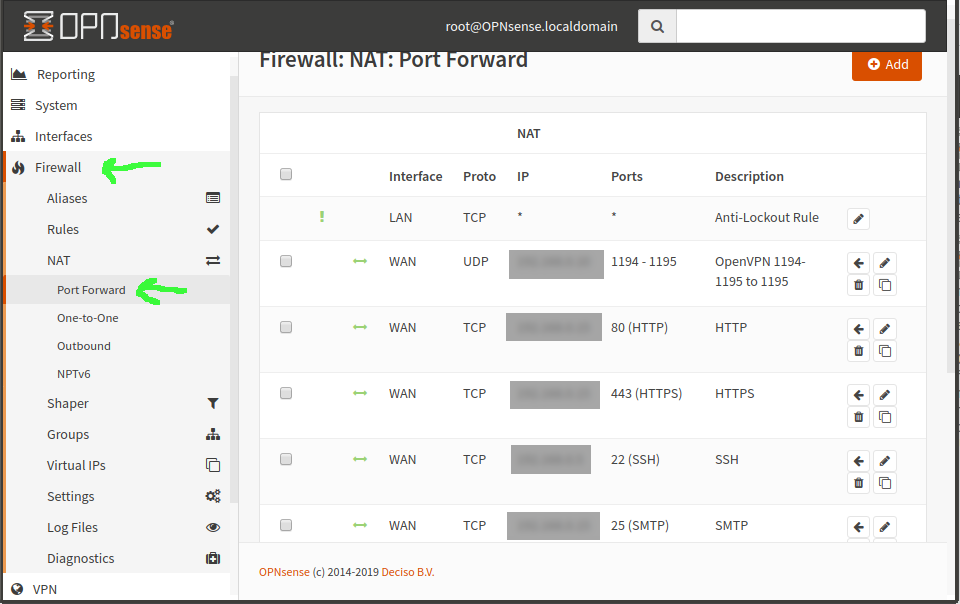
You’ve got a server on the LAN running OpenVPN, WireGuard, or some other VPN service. You port forwarded the VPN service port to that box, which was easy enough, under Firewall–>NAT–>Port Forward.
But now you need to set a static route through that LAN-located gateway machine, so that all the machines on the LAN can find it to respond to requests from the tunnel—eg, 10.8.0.0/24.
First step, in either OpnSense or pfSense, is to set up an additional gateway. In OpnSense, that’s System–>Gateways–>Single. Add a gateway with your VPN server’s LAN IP address, name it, done.
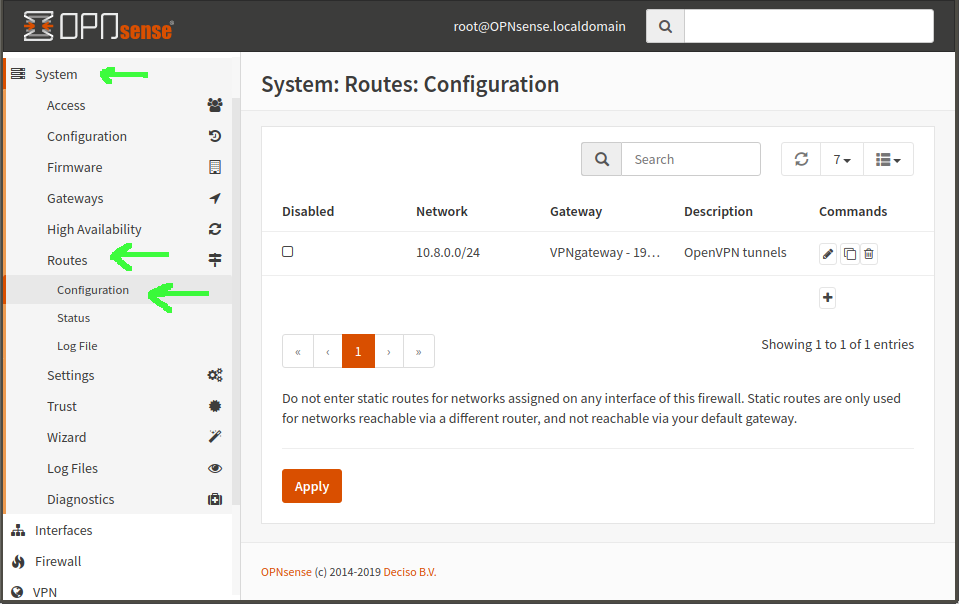
Now you create a static route, in System–>Routes–>Configuration. Network Address is the subnet of your tunnels—in our example, 10.8.0.0/24. Gateway is the new gateway you just created. Natch.
At this point, if you connect into the network over your VPN, your remote client will be able to successfully ping machines on the LAN… but not access any services. If you try nmap from the remote client, it shows all ports filtered. WTF?
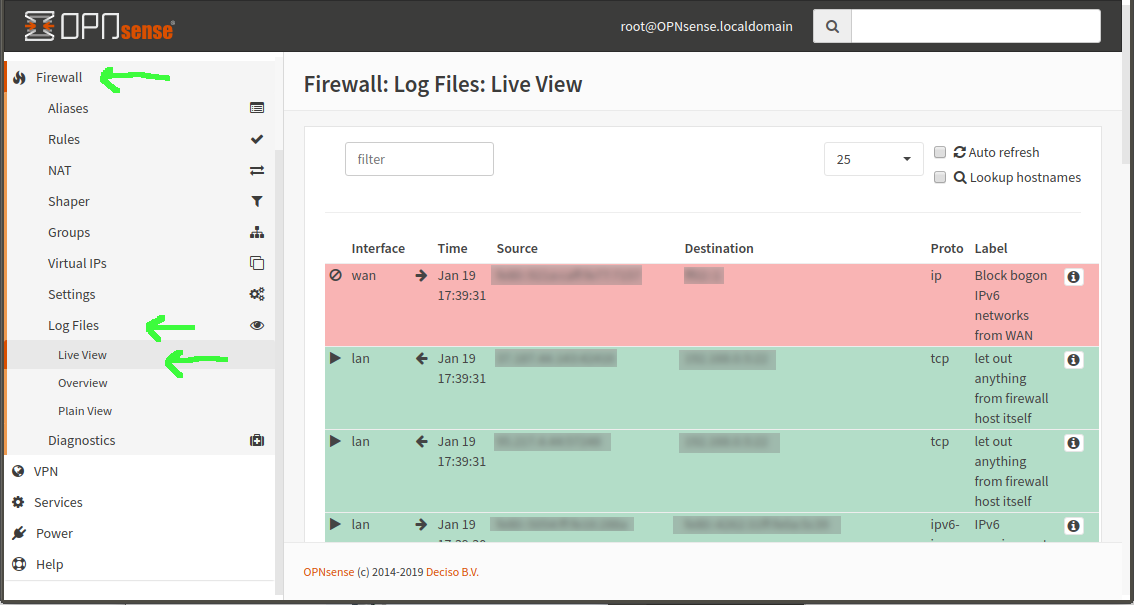
Diagnostically, you can go in the OpnSense GUI to Firewall–>Log Files–>Live View. If you try something nice and obnoxious like nmap that will constantly try to open connections, you’ll see tons of red as the connections from your remote machine are blocked, using Default Deny. But then you look at your LAN rules—and they’re default allow! WTF?
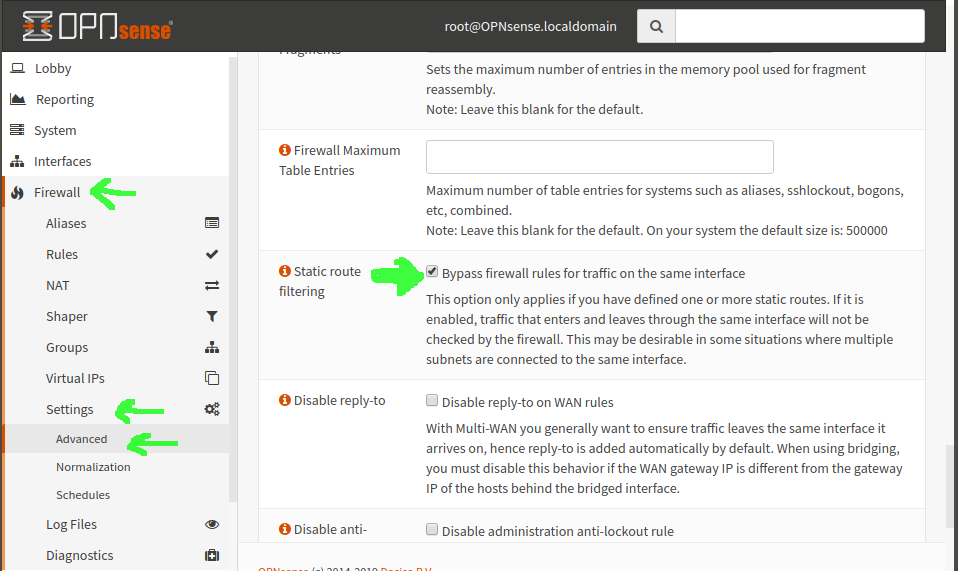
I can’t really answer W the F actually is, but I can, after much cursing, tell you how to fix it. Go in OpnSense to Firewall–>Settings–>Advanced and scroll most of the way down the page. Look for “Static route filtering” and check the box for “Bypass firewall rules for traffic on the same interface”—now click the Save button and, presto, when you go back to your live firewall view, you see tons of green on that nmap instead of tons of red—and, more importantly, your actual services can now connect from remote clients connected to the VPN.
I learned something new today—you can use an app called qrencode to create plain-ASCII QR codes on Ubuntu. This comes in super handy if you need to set up WireGuard tunnels on an Android phone or tablet, which otherwise tends to be a giant pain in the ass.
If you haven’t already, you’ll need to install qrencode itself; on Ubuntu that’s simply apt install qrencode and you’re ready. After that, just feed a tunnel config into the app, and it’ll display the QR code in the terminal. Your WireGuard mobile app has “from QR code” as an option in the tunnel import section; pick that, allow it to use the camera, and you’re off to the races!
While benchmarking the Ars Technica Hot Rod server build tonight, I decided to empirically demonstrate the effects of zfs set sync=disabled on a dataset.
In technical terms, sync=disabled tells ZFS “when an application requests that you sync() before returning, lie to it.” If you don’t have applications explicitly calling sync(), this doesn’t result in any difference at all. If you do, it tremendously increases write performance… but, remember, it does so by lying to applications that specifically request that a set of data be safely committed to disk before they do anything else. TL;DR: don’t do this unless you’re absolutely sure you don’t give a crap about your applications’ data consistency safeguards!
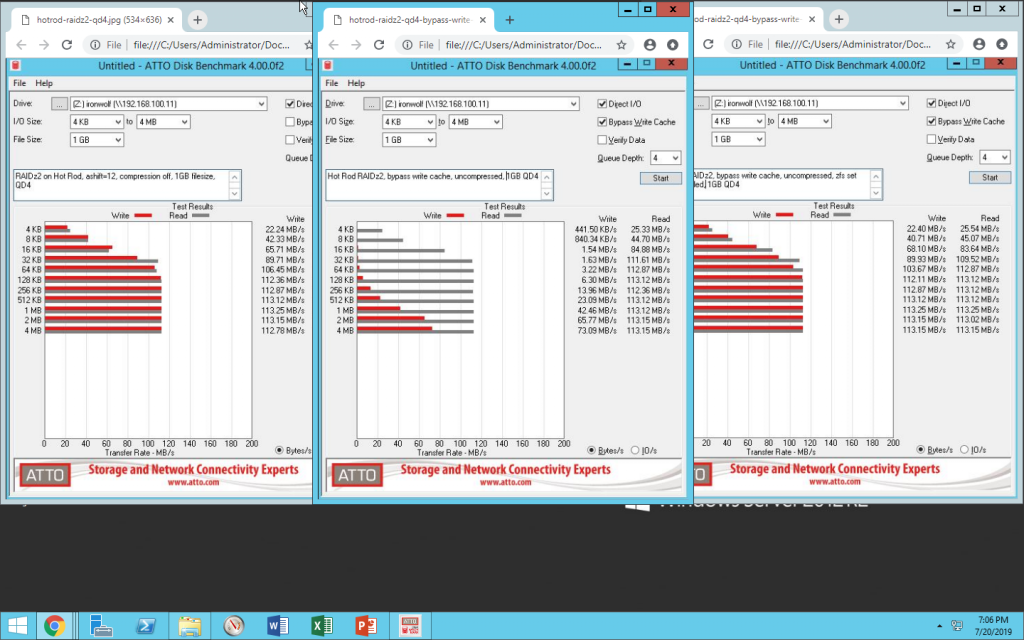
In the below screenshot, we see ATTO Disk Benchmark run across a gigabit LAN to a Samba share on a RAIDz2 pool of eight Seagate Ironwolf 12TB disks. On the left: write cache is enabled (meaning, no sync() calls). In the center: write cache is disabled (meaning, a sync() call after each block written). On the right: write cache is disabled, but zfs set sync=disabled has been set on the underlying dataset.
The effect is clear and obvious: zfs set sync=disabled lies to applications that request sync() calls, resulting in the exact same performance as if they’d never called sync() at all.
Finally, after I don’t know HOW many years, I figured out how to get continuously updated stats from iostat that don’t just scroll up the screen and piss you off.
For those of you who aren’t familiar, iostat gives you some really awesome per-disk reports that you can use to look for problems. Eg, on a system I’m moving a bunch of data around on at the moment:
In particular, note that %util column. That lets me see that /dev/sdb is the bottleneck on my current copy operation. (I expect this, since it’s a single disk reading small blocks and writing large blocks to a two-vdev pool, but if this were one big pool, it would be an indication of problems with sdb.)
But what if I want to see a continuously updated feed? Well, I can do iostat –human -xs 1 and get a new listing every second… but it just scrolls up the screen, too fast to read. Yuck.
OK, how about using the watch command instead? Well, normally, when you call iostat, the first output is a reading that averages the stats for all devices since the first boot. This one won’t change visibly very often unless the system was JUST booted, and almost certainly isn’t what you want. It also frustrates the heck out of any attempt to simply use watch.
The key here is the -y argument, which skips that first report which always gives you the summary of history since last boot, and gets straight to the continuous interval reports – and knowing that you need to specify an interval, and a count for iostat output. If you get all that right, you can finally use watch -n 1 to get a running output of iostat that doesn’t scroll up off the screen and drive you insane trying to follow it:
I’ve encountered this two or three times now, and it’s always a slog figuring out how to fix it. When doing a fresh install of Ubuntu 18.04 to a new system, it hangs forever (never times out, no matter how long you wait) at 66% running update-grub.
The problem is a bug in os-prober. The fix is to ctrl-alt-F2 into a new BusyBox shell, ps and grep for the offending process, and kill it:
BusyBox v1.27.2 (Ubuntu 1:1.27.2-2ubuntu3.1) built-in shell (ash)
Enter 'help' for a list of built-in commands.
# ps wwaux | grep dmsetup | grep -v grep
6114 root 29466 S dmsetup create -r osprober-linux-sdc9
# kill 6114
Now ctrl-alt-F1 back into your installer session. After a moment, it’ll kick back into high gear and finish your Ubuntu 18.04 installation… but you’re unfortunately not done yet; killing os-prober got the install to complete, but it didn’t get GRUB to actually install onto your disks.
You can get a shell and chroot into your new install environment right now, but if you’re not intimately familiar with that process, it may be easier to just reboot using the same Ubuntu install media, but this time select “Rescue broken system”. Once you’ve made your way through selecting your keyboard layout and given your system a bogus name (it only persists for this rescue environment; it doesn’t change on-disk configuration) you’ll be asked to pick an environment to boot into, with a list of disks and partitions.
If you installed root to a simple partition, pick that partition. If, like me, you installed to an mdraid array, you should see that array listed as “md127”, which is Ubuntu’s default name for an array it knows is there but otherwise doesn’t know much about. Choose that, and you’ll get a shell with everything already conveniently mounted and chrooted for you.
(If you didn’t have the option to get into the environment the simple way, you can still do it from a standard installer environment: find your root partition or array, mount it to /mnt like mount /dev/md127 /mnt ; then chroot into it like chroot /mnt and you’ll be caught up and ready to proceed.)
The last part is easy. First, we need to get the buggy os-prober module out of the execution path.
root@ubuntu:~# cd /etc/grub.d root@ubuntu:~/etc/grub.d# mkdir nerfed root@ubuntu:~/etc/grub.d# mv 30_os-prober/nerfed
OK, that got rid of our problem module that locked up on us during the install. Now we’re ready to run update-grub and grub-install. I’m assuming here that you have two disks which should be bootable, /dev/sda and /dev/sdb; if that doesn’t match your situation, adjust accordingly. (If you’re using an mdraid array, mdadm –detail /dev/md127 to tell you for sure which disks to make bootable.)
That’s it; now you can shutdown the system, pull the USB installer, and boot from the actual disks!
I’m stuck at update-grub, but it times out and errors!
If your update-grub process hangs for quite a while (couple full minutes?) at 50% but then falls to an angry error screen with a red background, you’ve got a different problem. If you’re trying to install with an mdraid root directory on a disk 4TiB or larger, you need to do a UEFI-style install – which requires EFI boot partitions available on each of your bootable disks.
You’re going to need to start the install process over again; this time when you partition your disks, make sure to create a small partition of type “EFI System Partition”. This is not the same partition you’ll use for your actual root; it’s also not the same thing as /boot – it’s a special snowflake all to itself, and it’s mandatory for systems booting from a drive or drives 4 TiB or larger. (You can still boot in BIOS mode, with no boot partition, from 2 TiB or smaller drives. Not sure about 3 TiB drives; I’ve never owned one IIRC.)
It’s been bugging me for a while that there are no correct guides to be found about using modern Apache 2.4 or above with the Event or Worker MPMs. We’re going to go ahead and correct that lapse today, by walking through a brand-new WordPress install on a new Ubuntu 18.04 VM (grab one for $5/mo at Linode, Digital Ocean, or your favorite host).
Installing system packages
Once you’ve set up the VM itself, you’ll first need to update the package list:
root@VM:~# apt update
Once it’s updated, you’ll need to install Apache itself, along with PHP and the various extras needed for a WordPress installation.
The key bits here are Apache2, your HTTP server; MySQL, your database server; and php-fpm, which is a pool of PHP worker processes your HTTP server can connect to in order to build WordPress dynamic content as necessary.
What you absolutely, positively do not want to do here is install mod_php. If you do that, your nice modern Apache2 with its nice modern Event process model gets immediately switched back to your granddaddy’s late-90s-style prefork, loading PHP processors into every single child process, and preventing your site from scaling if you get any significant traffic!
Enable the proxy_fcgi module
Instead – and this is the bit none of the guides I’ve found mention – you just need to enable one module in Apache itself, and enable the already-installed PHP configuration module. (You will need to figure out which version of php-fpm is installed: dpkg –get-selections | grep fpm can help here if you aren’t sure.)
Your Apache2 server is now ready to serve PHP applications, like WordPress. (Note for more advanced admins: if you’re tuning for larger scale, don’t forget that it’s not only about the web server connections anymore; you also want to keep an eye on how many PHP worker processes you have in your pool. You’ll do that in /etc/php/[version]/fpm/pool.d/www.conf.)
Download and extract WordPress
We’re going to keep things super simple in this guide, and just serve WordPress from the existing default vhost in its standard location, at /var/www/html.
root@VM:~# cd /var/www
root@VM:/var/www# wget https://wordpress.org/latest.tar.gz
root@VM:/var/www# tar zxvf latest.tar.gz
root@VM:/var/www# chown -R www-data.www-data wordpress
root@VM:/var/www# mv html html.dist
root@VM:/var/www# mv wordpress html
Create a database for WordPress
The last step before you can browse to your new WordPress installation is creating the database itself.
root@VM:/var/www# mysql -u root
mysql> create database wordpress;
Query OK, 1 row affected (0.01 sec)
mysql> grant all on wordpress.* to 'wordpress'@'localhost' identified by 'superduperpassword';
Query OK, 0 rows affected, 1 warning (0.00 sec)
mysql> exit;
This created a database named wordpress, with a user named wordpress, and a password superduperpassword. That’s a bad password. Don’t actually use that password. (Also, if mysql -u root wanted a password, and you don’t have it – cat /etc/mysql/debian.cnf, look for the debian-sys-maint password, and connect to mysql using mysql -u debian-sys-maint instead. Everything else will work fine.)
note for ubuntu 20.04 / mysql 8.0 users:
MySQL changed things a bit with 8.0. grant all on db.* to ‘user’@’localhost’ identified by ‘password’; no longer works all in one step. Instead, you’ll need first to create user ‘user’@’localhost’ identified by ‘password’; then you can grant all on db.* to ‘user’@’localhost’; —you no longer need to (or can) specify password on the actual grant line itself.
All done – browser time!
Now that you’ve set up Apache, dropped the WordPress installer in its default directory, and created a mysql database – you’re ready to run through the WordPress setup itself, by browsing directly to http://your.servers.ip.address/. Have fun!
Recently on r/zfs, the topic of ZIL (ZFS Intent Log) and SLOG (Secondary LOG device) came up again. It’s a frequently misunderstood part of the ZFS workflow, and I had to go back and correct some of my own misconceptions about it during the thread. ixSystems has a reasonably good explainer up – with the great advantage that it was apparently error-checked by Matt Ahrens, founding ZFS developer – but it could use a diagram or two to make the workflow clear.
In the normal course of operations on a basic pool with no special devices (such as a SLOG), the write workflow looks like this:
Unless explicitly declared as synchronous (by opening with O_SYNC set, or manually calling sync()), all writes are asynchronous. And – here’s the bit I find most people misunderstand – all writes, including synchronous writes, are aggregated in RAM and committed to the pool in TXGs (Transaction Groups) on a regular basis.
The difference with sync writes is, they’re also written to a special area of the pool called the ZIL – ZFS Intent Log – in parallel with writing them to the aggregator in RAM. This doesn’t mean the sync writes are actually committed to main storage immediately; it just means they’re buffered on-disk in a way that will survive a crash if necessary. The other key difference is that any asynchronous write operation returns immediately; but sync() calls don’t return until they’ve been committed to disk in the ZIL.
I want you to go back and look at that diagram again, though, and notice that there’s no arrow coming out of the ZIL. That’s not a bug – in normal operation, blocks written to the ZIL are never read from again; the sync writes still get committed to the main pool in TXGs from RAM alongside the async writes. The sync write blocks in the ZIL get unlinked after the copies of them in RAM get written out to the pool in TXGs.
During the import process for a zpool, ZFS checks the ZIL for any dirty writes. If it finds some (due to a kernel crash or system power event), it will replay them from the ZIL, aggregating them into TXG(s), and committing the TXG(s) to the pool as normal. Once the dirty writes from the ZIL have been committed and the ZIL itself cleared, the pool import can proceed normally and we’re back to diagram 1, normal operation.
Why would we want a SLOG?
While normal operation with the ZIL works very reliably, it introduces a couple of pretty serious performance drawbacks. With any filesystem, writing small groups of blocks to disk immediately without benefit of aggregation and ordering introduces serious IOPS (I/O Operations per Second) penalties.
With most filesystems, sync writes also introduce severe fragmentation penalties for any future reads of that data. ZFS avoids the increased future fragmentation penalty by writing the sync blocks out to disk as though they’d been asynchronous to begin with. While this avoids the future read fragmentation, it introduces a write amplification penalty at the time of committing the writes; small writes must be written out twice (once to ZIL and then again later in TXGs to main storage).
Larger writes avoid some of this write amplification by committing the blocks directly to main storage, committing a pointer to those blocks to the ZIL, and then only needing to update the pointer when writing out the permanent TXG later. This is pretty effective at minimizing the write throughput amplification, but doesn’t do much to mitigate write IOPS amplification – and, please repeat with me, most storage workloads bind on IOPS.
So if your system experiences a lot of sync write operations, a SLOG – Secondary LOG device – can help. The SLOG is a special standalone vdev that takes the place of the ZIL. It performs exactly like the ZIL, it just happens to be on a separate, isolated device – which means that “double writes” due to sync don’t consume the IOPS or throughput of the main storage itself. This also means the latency of the sync write operations themselves improves, since the call to sync() doesn’t return until after the data has been committed temporarily to disk – in this case, to the SLOG, which should be nice and idle in comparison with our busy main storage vdevs.
Ideally, your SLOG device should also be extremely fast, with tons of IOPS – read “fast solid state drive” – to get that sync write latency down as low as possible. However, the only speed we care about here is write speed; the SLOG, just like the ZIL, is never read from at all during normal operation. It also doesn’t need to be very large – just enough to hold a few seconds’ worth of writes. Remember, every time ZFS commits TXGs to the pool, it unlinks whatever’s in the SLOG/ZIL!
Pictured above is the only time the SLOG gets read from – after a crash, just like the ZIL. There really is zero difference between SLOG and ZIL, apart from the SLOG being separate from the main pool vdevs in order to conserve write throughput and IOPS, and minimize sync write latency.
Should I set sync=always with a fast SLOG?
Yes, you canzfs set sync=always to force all writes to a given dataset or zvol to be committed to the SLOG. But it won’t make your asynchronous writes go any faster. Remember, asynchronous write calls already return immediately – you literally can’t improve on that, no matter what you do.
You also can’t materially improve throughput, since the SLOG is only going to buffer a few seconds of writes before main commits to the pool via TXGs from RAM kick in.
The potential benefit to setting zfs sync=always isn’t speed, it’s safety.
If you’ve got applications that notoriously write unsafely and tend to screw themselves after a power outage or other crash – eg any databases using myISAM or other non-journalling storage engine – you might decide to set zfs sync=always on the dataset or zvol containing their back ends, to make certain that you don’t end up with a corrupt db after a crash. Again, you’re not going faster, you’re going safer.
OK, what about sync=disabled?
No matter how fast a SLOG you add, setting sync=always won’t make anything go faster. Setting sync=disabled, on the other hand, will definitely speed up any workload with a lot of synchronous writes.
sync=disabled decreases latency at the expense of safety.
If you have an application that calls sync() (or opens O_SYNC) far too often for your tastes and you think it’s just a nervous nelly, setting sync=disabled forces its synchronous writes to be handled as asynchronous, eliminating any double write penalty (with only ZIL) or added latency waiting for on-disk commits. But you’d better know exactly what you’re doing – and be willing to cheerfully say “welp, that one’s on me” if you have a kernel crash or power failure, and your application comes back with corrupt data due to missing writes that it had depended on being already committed to disk.
ZFS stores data in records—also known as, and interchangeably referred to by OpenZFS devs as blocks—which are themselves composed of on-disk sectors. The physical sector size on disk is set by the ashift value at time of vdev creation, and is immutable. The recordsize, on the other hand, is individual to each dataset(although it can be inherited from parent datasets), and can be changed at any time you like. In 2019, recordsize defaults to 128K if not explicitly set.
The general rule of recordsize is that it should closely match the typical workload experienced within that dataset. For example, a dataset used to store high-quality JPGs, averaging 5MB or more, should have recordsize=1M. This matches the typical I/O seen in that dataset – either reading or writing a full 5+ MB JPG, with no random access within each file – quite well; setting that larger recordsize prevents the files from becoming unduly fragmented, ensuring the fewest IOPS are consumed during either read or write of the data within that dataset.
By contrast, a dataset which directly contains a MySQL InnoDB database should have recordsize=16K. That’s because InnoDB defaults to a 16KB page size, so most operations on an InnoDB database will be done in individual 16K chunks of data. Matching recordsize to MySQL’s page size here means we maximize the available IOPS, while minimizing latency on the highly sync()hronous reads and writes made by the database (since we don’t need to read or write extraneous data while handling our MySQL pages).
On the other hand, if you’ve got a MySQL InnoDB database stored within a VM, your optimal recordsize won’t necessarily be either of the above – for example, KVM .qcow2 files default to a cluster_size of 64KB. If you’ve set up a VM on .qcow2 with default cluster_size, you don’t want to set recordsize any lower (or higher!) than the cluster_size of the .qcow2 file. So in this case, you’ll want recordsize=64K to match the .qcow2’s cluster_size=64K, even though the InnoDB database inside the VM is probably using smaller pages.
An advanced administrator might look at all of this, determine that a VM’s primary function in life is to run MySQL, that MySQL’s default page size is good, and therefore set both the .qcow2 cluster_sizeand the dataset’s recordsize to match, at 16K each.
A different administrator might look at all this, determine that the performance of MySQL in the VM with all the relevant settings left to their defaults was perfectly fine, and elect not to hand-tune all this crap at all. And that’s okay.
What if I set recordsize too high?
If recordsize is much higher than the size of the typical storage operation within the dataset, latency will be greatly increased and this is likely to be incredibly frustrating. IOPS will be very limited, databases will perform poorly, desktop UI will be glacial, etc.
What if I set recordsize too low?
If recordsize is a lot smaller than the size of the typical storage operation within the dataset, fragmentation will be greatly (and unnecessarily) increased, leading to unnecessary performance problems down the road. IOPS as measured by artificial tools will be super high, but performance profiles will be limited to those presented by random I/O at the record size you’ve set, which in turn can be significantly worse than the performance profile of larger block operations.
You’ll also screw up compression with an unnecessarily low recordsize; zfs inline compression dictionaries are per-record, and work by fitting the contents of a single logical record (aka block) into fewer on-disk sectors than it would have needed if uncompressed.
If you set compression=lz4, ashift=12, and recordsize=4K you’ll effectively have NO compression, because your sector size is equal to your recordsize—and you can’t store data in “half a sector”, so compressing a one-sector record down to 0.5 sectors’ worth of data would not result in less usage of on-disk capacity.
Meanwhile, the same dataset with the default 128K recordsize might easily have a 1.7:1 compression ratio.
Are the defaults good? Do I aim high, or do I aim low?
128K is a pretty reasonable “ah, what the heck, it works well enough” setting in general. It penalizes you significantly on IOPS and latency for small random I/O operations, and it presents more fragmentation than necessary for large contiguous files, but it’s not horrible at either task. There is a lot to be gained from tuning recordsize more appropriately for task, though.
What about bittorrent?
This is one of those cases where things work just the opposite of how you might think – torrents write data in relatively small chunks, and access them randomly for both read and write, so you might reasonably think this calls for a small recordsize. However, the actual data in the torrents is typically huge files, which are accessed in their entirety for everything but the initial bittorrent session.
Since the typical access pattern is “large-file”, most people will be better off using recordsize=1M in the torrent target storage. This keeps the downloaded data unfragmented despite the bittorrent client’s insanely random writing patterns. The data acquired during the bittorrent session in chunks is accumulated in the ZIL until a full record is available to write, since the torrent client itself is not synchronous – it writes all the time, but rarely if ever calls sync().
As a proof-of-concept, I used the Transmission client on an Ubuntu 16.04 LTS workstation to download the Ubuntu 18.04.2 Server LTS ISO, with a dataset using recordsize=1M as the target. This workstation has a pool consisting of two mirror vdevs on rust, so high levels of fragmentation would be very easy to spot.
Exporting the pool and unloading the ZFS kernel module entirely is a weapons-grade-certain method of emptying the ARC entirely; getting better than 200 MB/sec average read throughput directly from the rust vdevs afterward (the transfer actually peaked at nearly 400 MB/sec!) confirms that our torrented ISO is not fragmented.
Note that preallocation settings in your bittorrent client are meaningless when the client is saving to ZFS – you can’t actually preallocate in any meaningful way on ZFS, because it’s a copy-on-write filesystem.
I have a client who’s using Varnish as a caching reverse proxy for a site which sometimes experiences extremely heavy traffic that the actual web server can’t handle. The client wanted to start offering HTTPS on the website, and I suggested Let’s Encrypt, with its automatically self-renewing 90-day certs, to avoid the yearly hassle of manually renewing certificates with a provider, updating configs, etc.
Varnish does an incredibly good job at handling absurd amounts of traffic… but what it doesn’t do is SSL termination. Nginx, on the other hand, does SSL termination just fine – I’ve had difficulty in the past getting Apache to reverse-proxy HTTPS down to HTTP without hiccups, but it’s a breeze with nginx.
The problem is, how do we get Let’s Encrypt working when it isn’t installed on the root webserver? Certbot’s automatic renewal process depends on updating files on the actual website, in order to demonstrate to the CA that we are who we say we are (since our website is what DNS resolves to). The secret is nginx’s extremely flexible Location blocks, and knowing exactly where CertBot wants to create its identify files for remote verification.
Long story short, we want nginx proxying everything on https://website.tld/ to http//website.tld/ on the back end server. The first step for me was putting an entry in /etc/hosts that points website.tld to the back end server’s IP address (5.6.7.8) , not to the front-end proxy’s own (1.2.3.4).
That way when we tell nginx that we want it to proxy requests made for website.tld to website.tld, it will correctly connect out to the back end server rather than to itself.
With that done, we create a stub directory for the site using mkdir -p /var/www/website.tld ; chown -R www-data.www-data /var/www and then create a simple site config at /etc/nginx/sites-available/website.tld:
This simple config proxies all requests made to website.tld except those looking for content in or under .well_known – CertBot’s challenge directory – which it serves directly from the local machine itself.
After symlinking the site live and restarting nginx – ln -s /etc/nginx/sites-available/website.tld /etc/nginx/sites-enabled/website.tld && /etc/init.d/nginx restart – we’re ready to install certbot.
Now that certbot’s installed, we just need to run it once and let it automatically configure. Note that I chose to have Certbot automatically configure nginx to force-redirect all HTTP traffic to HTTPS for me. (And don’t judge me for not saying yes to giving the email address to the EFF: that’s because I’m already on the mailinglist, and a dues-paid-up member!)
root@proxy:~# certbot --nginx
Saving debug log to /var/log/letsencrypt/letsencrypt.log
Plugins selected: Authenticator nginx, Installer nginx
Enter email address (used for urgent renewal and security notices) (Enter 'c' to cancel): you@website.tld
- - - - - - - - - - - - - - - - - - - - - - - - - - - - - - - - - - - - - - - -
Please read the Terms of Service at https://letsencrypt.org/documents/LE-SA-v1.2-November-15-2017.pdf. You must agree in order to register with the ACME server at https://acme-v02.api.letsencrypt.org/directory
- - - - - - - - - - - - - - - - - - - - - - - - - - - - - - - - - - - - - - - -
(A)gree/(C)ancel: A
- - - - - - - - - - - - - - - - - - - - - - - - - - - - - - - - - - - - - - - -
Would you be willing to share your email address with the Electronic Frontier Foundation, a founding partner of the Let's Encrypt project and the non-profit organization that develops Certbot? We'd like to send you email about our work encrypting the web, EFF news, campaigns, and ways to support digital freedom.
- - - - - - - - - - - - - - - - - - - - - - - - - - - - - - - - - - - - - - - -
(Y)es/(N)o: N
Which names would you like to activate HTTPS for?
- - - - - - - - - - - - - - - - - - - - - - - - - - - - - - - - - - - - - - - -
1: website.tld
2: www.website.tld
- - - - - - - - - - - - - - - - - - - - - - - - - - - - - - - - - - - - - - - -
Select the appropriate numbers separated by commas and/or spaces, or leave input
blank to select all options shown (Enter 'c' to cancel):
Obtaining a new certificate
Performing the following challenges:
http-01 challenge for website.tld
http-01 challenge for www.website.tld
Waiting for verification...
Cleaning up challenges
Deploying Certificate to VirtualHost /etc/nginx/sites-enabled/website.tld
Please choose whether or not to redirect HTTP traffic to HTTPS, removing HTTP access.
- - - - - - - - - - - - - - - - - - - - - - - - - - - - - - - - - - - - - - - -
1: No redirect - Make no further changes to the webserver configuration.
2: Redirect - Make all requests redirect to secure HTTPS access. Choose this for new sites, or if you're confident your site works on HTTPS. You can undo this change by editing your web server's configuration.
- - - - - - - - - - - - - - - - - - - - - - - - - - - - - - - - - - - - - - - -
Select the appropriate number [1-2] then [enter] (press 'c' to cancel): 2
Redirecting all traffic on port 80 to ssl in /etc/nginx/sites-enabled/website.tld
- - - - - - - - - - - - - - - - - - - - - - - - - - - - - - - - - - - - - - - -
Congratulations! You have successfully enabled https://website.tld and
https://www.website.tld
You should test your configuration at:
https://www.ssllabs.com/ssltest/analyze.html?d=website.tld
https://www.ssllabs.com/ssltest/analyze.html?d=www.website.tld
- - - - - - - - - - - - - - - - - - - - - - - - - - - - - - - - - - - - - - - -
IMPORTANT NOTES:
- Congratulations! Your certificate and chain have been saved at:
/etc/letsencrypt/live/website.tld/fullchain.pem
Your key file has been saved at:
/etc/letsencrypt/live/website.tld/privkey.pem
Your cert will expire on 2019-03-22. To obtain a new or tweaked
version of this certificate in the future, simply run certbot again
with the "certonly" option. To non-interactively renew *all* of
your certificates, run "certbot renew"
- Your account credentials have been saved in your Certbot
configuration directory at /etc/letsencrypt. You should make a
secure backup of this folder now. This configuration directory will
also contain certificates and private keys obtained by Certbot so
making regular backups of this folder is ideal.
- If you like Certbot, please consider supporting our work by:
Donating to ISRG / Let's Encrypt: https://letsencrypt.org/donate
Donating to EFF: https://eff.org/donate-le
That’s it. You should test the renewal process once using certbot renew --dry-run, and make sure it works (it should; mine certainly did). There’s already a cron job created for you in /etc/cron.d, so you don’t need to do anything else – you’ve got working SSL on your reverse proxy server now.