You want to reclaim space on a ZFS pool by deleting some old snapshots. Problem is, you take snapshots frequently, so they all have deceptively low REFER values—REFER only shows you the space unique to a snapshot, so it’s entirely possible that deleting two snapshots that each show REFER of 1MiB will actually remove 100GiB of data.
How, you ask? Well, if that 100GiB of data is common to both snapshots, it won’t show up on the REFER of either—but if it was present in only those two snapshots, deleting them both unlinks that 100GiB and marks it free again.
Luckily, zfs destroy has a dry-run option, and can be used to delete sequences of snapshots. So you can see before-hand how much space will be reclaimed by deleting a sequence of snapshots, like this:
root@box:~# zfs destroy -nv pool/dataset@snap4%snap8
would destroy pool/dataset@snap4
would destroy pool/dataset@snap5
would destroy pool/dataset@snap6
would destroy pool/dataset@snap7
would destroy pool/dataset@snap8
would reclaim 25.2G
Let’s Encrypt certificates work just dandy not only for HTTPS, but also for SSL/TLS on IMAP and SMTP services in mailservers. I deployed Let’s Encrypt to replace manually-purchased-and-deployed certificates on a client server in 2019, and today, users started reporting they were getting certificate expiration errors in mail clients.
When I checked the server using TLS checking tools, they reported that the certificate was fine; both the tools and a manual check of the datestamp on the actual .pem file showed that it had been updating just fine, with the most recent update happening in January and extending the certificate validation until April. WTF?
As it turns out, the problem is that Dovecot—which handles IMAP duties on the server—doesn’t notice when the certificate has been updated on disk; it will cheerfully keep using an in-memory cached copy of whatever certificate was present when the service started until time immemorial.
The way to detect this was to use openssl on the command line to connect directly to the IMAPS port:
--- No client certificate CA names sent Peer signing digest: SHA256 Peer signature type: RSA Server Temp Key: ECDH, P-384, 384 bits --- SSL handshake has read 3270 bytes and written 478 bytes Verification error: certificate has expired
So obviously, the Dovecot service hadn’t reloaded the certificate after Certbot-auto renewed it. One /etc/init.d/dovecot restart later, running the same command instead produced (among all the other verbiage):
--- Server certificate subject=CN = mail.example.com
--- No client certificate CA names sent Peer signing digest: SHA256 Peer signature type: RSA Server Temp Key: ECDH, P-384, 384 bits --- SSL handshake has read 3269 bytes and written 478 bytes Verification: OK ---
With the immediate problem resolved, the next step was to make sure Dovecot gets automatically restarted frequently enough to pick new certs up before they expire. You could get fancy and modify certbot’s cron job to include a Dovecot restart; you can find certbot’s cron job with grep -ir certbot /etc/crontab and add a –deploy-hook argument to restart after new certificates are obtained (and only after new certificates are obtained).
But I don’t really recommend doing it that way; the cron job might get automatically updated with an upgraded version of certbot at some point in the future. Instead, I created a new root cron job to restart Dovecot once every Sunday at midnight:
# m h dom mon dow   command
  0 0 *   *   Sun   /etc/init.d/dovecot restart
Since Certbot renews any certificate with 30 days or less until expiration, and the Sunday restart will pick up new certificates within 7 days of their deployment, we should be fine with this simple brute-force approach rather than a more efficient—but also more fragile—approach tying the update directly to restarting Dovecot using the –deploy-hook argument.
Inside your Windows VM, open an elevated command prompt (right-click Command Prompt from the Start menu, and Run as Administrator), then issue the following command:
bcdedit /set useplatformclock true
Now, you need to restart the guest—this change is persistent, but it doesn’t actually take effect until the guest reboots! After the reboot, the guest’s clock will stop drifting.
I learned something new today—you can use an app called qrencode to create plain-ASCII QR codes on Ubuntu. This comes in super handy if you need to set up WireGuard tunnels on an Android phone or tablet, which otherwise tends to be a giant pain in the ass.
If you haven’t already, you’ll need to install qrencode itself; on Ubuntu that’s simply apt install qrencode and you’re ready. After that, just feed a tunnel config into the app, and it’ll display the QR code in the terminal. Your WireGuard mobile app has “from QR code” as an option in the tunnel import section; pick that, allow it to use the camera, and you’re off to the races!
Just like that, your WireGuard tunnel is ready to import into your phone or tablet.
While benchmarking the Ars Technica Hot Rod server build tonight, I decided to empirically demonstrate the effects of zfs set sync=disabled on a dataset.
In technical terms, sync=disabled tells ZFS “when an application requests that you sync() before returning, lie to it.” If you don’t have applications explicitly calling sync(), this doesn’t result in any difference at all. If you do, it tremendously increases write performance… but, remember, it does so by lying to applications that specifically request that a set of data be safely committed to disk before they do anything else. TL;DR: don’t do this unless you’re absolutely sure you don’t give a crap about your applications’ data consistency safeguards!
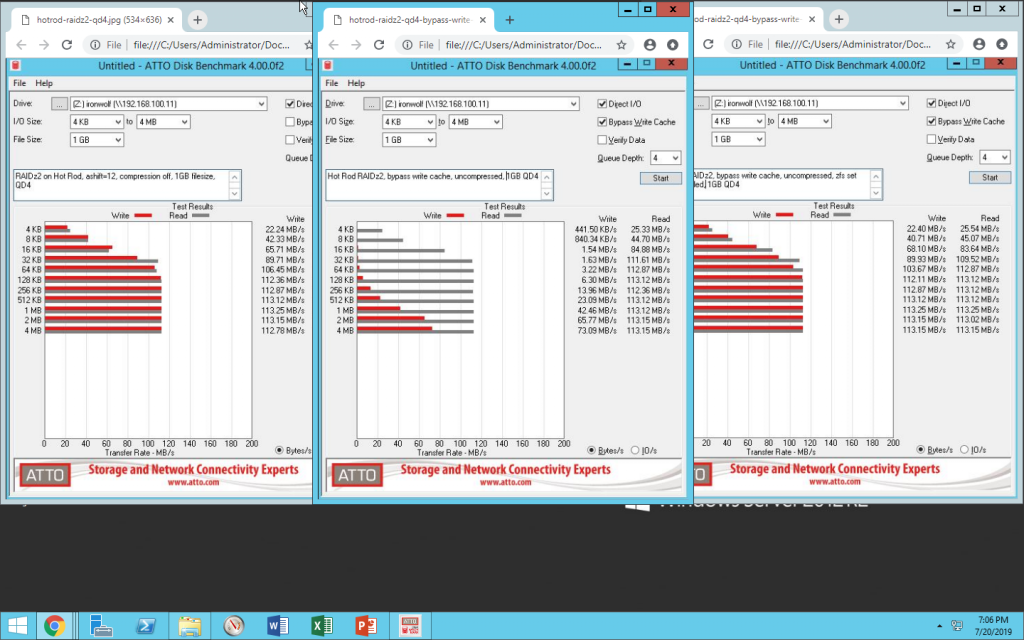
In the below screenshot, we see ATTO Disk Benchmark run across a gigabit LAN to a Samba share on a RAIDz2 pool of eight Seagate Ironwolf 12TB disks. On the left: write cache is enabled (meaning, no sync() calls). In the center: write cache is disabled (meaning, a sync() call after each block written). On the right: write cache is disabled, but zfs set sync=disabled has been set on the underlying dataset.
L-R: no sync(), sync(), lying in response to sync().
The effect is clear and obvious: zfs set sync=disabled lies to applications that request sync() calls, resulting in the exact same performance as if they’d never called sync() at all.
Finally, after I don’t know HOW many years, I figured out how to get continuously updated stats from iostat that don’t just scroll up the screen and piss you off.
For those of you who aren’t familiar, iostat gives you some really awesome per-disk reports that you can use to look for problems. Eg, on a system I’m moving a bunch of data around on at the moment:
In particular, note that %util column. That lets me see that /dev/sdb is the bottleneck on my current copy operation. (I expect this, since it’s a single disk reading small blocks and writing large blocks to a two-vdev pool, but if this were one big pool, it would be an indication of problems with sdb.)
But what if I want to see a continuously updated feed? Well, I can do iostat –human -xs 1 and get a new listing every second… but it just scrolls up the screen, too fast to read. Yuck.
OK, how about using the watch command instead? Well, normally, when you call iostat, the first output is a reading that averages the stats for all devices since the first boot. This one won’t change visibly very often unless the system was JUST booted, and almost certainly isn’t what you want. It also frustrates the heck out of any attempt to simply use watch.
The key here is the -y argument, which skips that first report which always gives you the summary of history since last boot, and gets straight to the continuous interval reports – and knowing that you need to specify an interval, and a count for iostat output. If you get all that right, you can finally use watch -n 1 to get a running output of iostat that doesn’t scroll up off the screen and drive you insane trying to follow it:
I’ve encountered this two or three times now, and it’s always a slog figuring out how to fix it. When doing a fresh install of Ubuntu 18.04 to a new system, it hangs forever (never times out, no matter how long you wait) at 66% running update-grub.
The problem is a bug in os-prober. The fix is to ctrl-alt-F2 into a new BusyBox shell, ps and grep for the offending process, and kill it:
BusyBox v1.27.2 (Ubuntu 1:1.27.2-2ubuntu3.1) built-in shell (ash)
Enter 'help' for a list of built-in commands.

# ps wwaux | grep dmsetup | grep -v grep
6114   root   29466 S    dmsetup create -r osprober-linux-sdc9

# kill 6114
Now ctrl-alt-F1 back into your installer session. After a moment, it’ll kick back into high gear and finish your Ubuntu 18.04 installation… but you’re unfortunately not done yet; killing os-prober got the install to complete, but it didn’t get GRUB to actually install onto your disks.
You can get a shell and chroot into your new install environment right now, but if you’re not intimately familiar with that process, it may be easier to just reboot using the same Ubuntu install media, but this time select “Rescue broken system”. Once you’ve made your way through selecting your keyboard layout and given your system a bogus name (it only persists for this rescue environment; it doesn’t change on-disk configuration) you’ll be asked to pick an environment to boot into, with a list of disks and partitions.
If you installed root to a simple partition, pick that partition. If, like me, you installed to an mdraid array, you should see that array listed as “md127”, which is Ubuntu’s default name for an array it knows is there but otherwise doesn’t know much about. Choose that, and you’ll get a shell with everything already conveniently mounted and chrooted for you.
(If you didn’t have the option to get into the environment the simple way, you can still do it from a standard installer environment: find your root partition or array, mount it to /mnt like mount /dev/md127 /mnt ; then chroot into it like chroot /mnt and you’ll be caught up and ready to proceed.)
The last part is easy. First, we need to get the buggy os-prober module out of the execution path.
root@ubuntu:~# cd /etc/grub.d
root@ubuntu:~/etc/grub.d# mkdir nerfed
root@ubuntu:~/etc/grub.d# mv 30_os-prober/nerfed
OK, that got rid of our problem module that locked up on us during the install. Now we’re ready to run update-grub and grub-install. I’m assuming here that you have two disks which should be bootable, /dev/sda and /dev/sdb; if that doesn’t match your situation, adjust accordingly. (If you’re using an mdraid array, mdadm –detail /dev/md127 to tell you for sure which disks to make bootable.)
That’s it; now you can shutdown the system, pull the USB installer, and boot from the actual disks!
I’m stuck at update-grub, but it times out and errors!
If your update-grub process hangs for quite a while (couple full minutes?) at 50% but then falls to an angry error screen with a red background, you’ve got a different problem. If you’re trying to install with an mdraid root directory on a disk 4TiB or larger, you need to do a UEFI-style install – which requires EFI boot partitions available on each of your bootable disks.
You’re going to need to start the install process over again; this time when you partition your disks, make sure to create a small partition of type “EFI System Partition”. This is not the same partition you’ll use for your actual root; it’s also not the same thing as /boot – it’s a special snowflake all to itself, and it’s mandatory for systems booting from a drive or drives 4 TiB or larger. (You can still boot in BIOS mode, with no boot partition, from 2 TiB or smaller drives. Not sure about 3 TiB drives; I’ve never owned one IIRC.)
It’s been bugging me for a while that there are no correct guides to be found about using modern Apache 2.4 or above with the Event or Worker MPMs. We’re going to go ahead and correct that lapse today, by walking through a brand-new WordPress install on a new Ubuntu 18.04 VM (grab one for $5/mo at Linode, Digital Ocean, or your favorite host).
Installing system packages
Once you’ve set up the VM itself, you’ll first need to update the package list:
root@VM:~# apt update
Once it’s updated, you’ll need to install Apache itself, along with PHP and the various extras needed for a WordPress installation.
The key bits here are Apache2, your HTTP server; MySQL, your database server; and php-fpm, which is a pool of PHP worker processes your HTTP server can connect to in order to build WordPress dynamic content as necessary.
What you absolutely, positively do not want to do here is install mod_php. If you do that, your nice modern Apache2 with its nice modern Event process model gets immediately switched back to your granddaddy’s late-90s-style prefork, loading PHP processors into every single child process, and preventing your site from scaling if you get any significant traffic!
Enable the proxy_fcgi module
Instead – and this is the bit none of the guides I’ve found mention – you just need to enable one module in Apache itself, and enable the already-installed PHP configuration module. (You will need to figure out which version of php-fpm is installed: dpkg –get-selections | grep fpm can help here if you aren’t sure.)
Your Apache2 server is now ready to serve PHP applications, like WordPress. (Note for more advanced admins: if you’re tuning for larger scale, don’t forget that it’s not only about the web server connections anymore; you also want to keep an eye on how many PHP worker processes you have in your pool. You’ll do that in /etc/php/[version]/fpm/pool.d/www.conf.)
Download and extract WordPress
We’re going to keep things super simple in this guide, and just serve WordPress from the existing default vhost in its standard location, at /var/www/html.
root@VM:~# cd /var/www
root@VM:/var/www# wget https://wordpress.org/latest.tar.gz
root@VM:/var/www# tar zxvf latest.tar.gz
root@VM:/var/www# chown -R www-data.www-data wordpress
root@VM:/var/www# mv html html.dist
root@VM:/var/www# mv wordpress html
Create a database for WordPress
The last step before you can browse to your new WordPress installation is creating the database itself.
root@VM:/var/www# mysql -u root

mysql> create database wordpress;
Query OK, 1 row affected (0.01 sec)

mysql> grant all on wordpress.* to 'wordpress'@'localhost' identified by 'superduperpassword';
Query OK, 0 rows affected, 1 warning (0.00 sec)

mysql> exit;
This created a database named wordpress, with a user named wordpress, and a password superduperpassword. That’s a bad password. Don’t actually use that password. (Also, if mysql -u root wanted a password, and you don’t have it – cat /etc/mysql/debian.cnf, look for the debian-sys-maint password, and connect to mysql using mysql -u debian-sys-maint instead. Everything else will work fine.)
note for ubuntu 20.04 / mysql 8.0 users:
MySQL changed things a bit with 8.0. grant all on db.* to ‘user’@’localhost’ identified by ‘password’; no longer works all in one step. Instead, you’ll need first to create user ‘user’@’localhost’ identified by ‘password’; then you can grant all on db.* to ‘user’@’localhost’; —you no longer need to (or can) specify password on the actual grant line itself.
All done – browser time!
Now that you’ve set up Apache, dropped the WordPress installer in its default directory, and created a mysql database – you’re ready to run through the WordPress setup itself, by browsing directly to http://your.servers.ip.address/. Have fun!
ZFS stores data in records—also known as, and interchangeably referred to by OpenZFS devs as blocks—which are themselves composed of on-disk sectors. The physical sector size on disk is set by the ashift value at time of vdev creation, and is immutable. The recordsize, on the other hand, is individual to each dataset(although it can be inherited from parent datasets), and can be changed at any time you like. In 2019, recordsize defaults to 128K if not explicitly set.
big files? big recordsize.
The general rule of recordsize is that it should closely match the typical workload experienced within that dataset. For example, a dataset used to store high-quality JPGs, averaging 5MB or more, should have recordsize=1M. This matches the typical I/O seen in that dataset – either reading or writing a full 5+ MB JPG, with no random access within each file – quite well; setting that larger recordsize prevents the files from becoming unduly fragmented, ensuring the fewest IOPS are consumed during either read or write of the data within that dataset.
DB binaries? Smaller recordsize.
By contrast, a dataset which directly contains a MySQL InnoDB database should have recordsize=16K. That’s because InnoDB defaults to a 16KB page size, so most operations on an InnoDB database will be done in individual 16K chunks of data. Matching recordsize to MySQL’s page size here means we maximize the available IOPS, while minimizing latency on the highly sync()hronous reads and writes made by the database (since we don’t need to read or write extraneous data while handling our MySQL pages).
VMs? Match the recordsize to the VM storage format.
(That’s cluster_size, for QEMU/KVM .qcow2.)
On the other hand, if you’ve got a MySQL InnoDB database stored within a VM, your optimal recordsize won’t necessarily be either of the above – for example, KVM .qcow2 files default to a cluster_size of 64KB. If you’ve set up a VM on .qcow2 with default cluster_size, you don’t want to set recordsize any lower (or higher!) than the cluster_size of the .qcow2 file. So in this case, you’ll want recordsize=64K to match the .qcow2’s cluster_size=64K, even though the InnoDB database inside the VM is probably using smaller pages.
An advanced administrator might look at all of this, determine that a VM’s primary function in life is to run MySQL, that MySQL’s default page size is good, and therefore set both the .qcow2 cluster_sizeand the dataset’s recordsize to match, at 16K each.
A different administrator might look at all this, determine that the performance of MySQL in the VM with all the relevant settings left to their defaults was perfectly fine, and elect not to hand-tune all this crap at all. And that’s okay.
What if I set recordsize too high?
If recordsize is much higher than the size of the typical storage operation within the dataset, latency will be greatly increased and this is likely to be incredibly frustrating. IOPS will be very limited, databases will perform poorly, desktop UI will be glacial, etc.
What if I set recordsize too low?
If recordsize is a lot smaller than the size of the typical storage operation within the dataset, fragmentation will be greatly (and unnecessarily) increased, leading to unnecessary performance problems down the road. IOPS as measured by artificial tools will be super high, but performance profiles will be limited to those presented by random I/O at the record size you’ve set, which in turn can be significantly worse than the performance profile of larger block operations.
You’ll also screw up compression with an unnecessarily low recordsize; zfs inline compression dictionaries are per-record, and work by fitting the contents of a single logical record (aka block) into fewer on-disk sectors than it would have needed if uncompressed.
If you set compression=lz4, ashift=12, and recordsize=4K you’ll effectively have NO compression, because your sector size is equal to your recordsize—and you can’t store data in “half a sector”, so compressing a one-sector record down to 0.5 sectors’ worth of data would not result in less usage of on-disk capacity.
Meanwhile, the same dataset with the default 128K recordsize might easily have a 1.7:1 compression ratio.
Are the defaults good? Do I aim high, or do I aim low?
128K is a pretty reasonable “ah, what the heck, it works well enough” setting in general. It penalizes you significantly on IOPS and latency for small random I/O operations, and it presents more fragmentation than necessary for large contiguous files, but it’s not horrible at either task. There is a lot to be gained from tuning recordsize more appropriately for task, though.
What about bittorrent?
The “big records for big files” rule of thumb still applies for datasets used as bittorrent targets.
This is one of those cases where things work just the opposite of how you might think – torrents write data in relatively small chunks, and access them randomly for both read and write, so you might reasonably think this calls for a small recordsize. However, the actual data in the torrents is typically huge files, which are accessed in their entirety for everything but the initial bittorrent session.
Since the typical access pattern is “large-file”, most people will be better off using recordsize=1M in the torrent target storage. This keeps the downloaded data unfragmented despite the bittorrent client’s insanely random writing patterns. The data acquired during the bittorrent session in chunks is accumulated in the ZIL until a full record is available to write, since the torrent client itself is not synchronous – it writes all the time, but rarely if ever calls sync().
As a proof-of-concept, I used the Transmission client on an Ubuntu 16.04 LTS workstation to download the Ubuntu 18.04.2 Server LTS ISO, with a dataset using recordsize=1M as the target. This workstation has a pool consisting of two mirror vdevs on rust, so high levels of fragmentation would be very easy to spot.
Exporting the pool and unloading the ZFS kernel module entirely is a weapons-grade-certain method of emptying the ARC entirely; getting better than 200 MB/sec average read throughput directly from the rust vdevs afterward (the transfer actually peaked at nearly 400 MB/sec!) confirms that our torrented ISO is not fragmented.
Note that preallocation settings in your bittorrent client are meaningless when the client is saving to ZFS – you can’t actually preallocate in any meaningful way on ZFS, because it’s a copy-on-write filesystem.
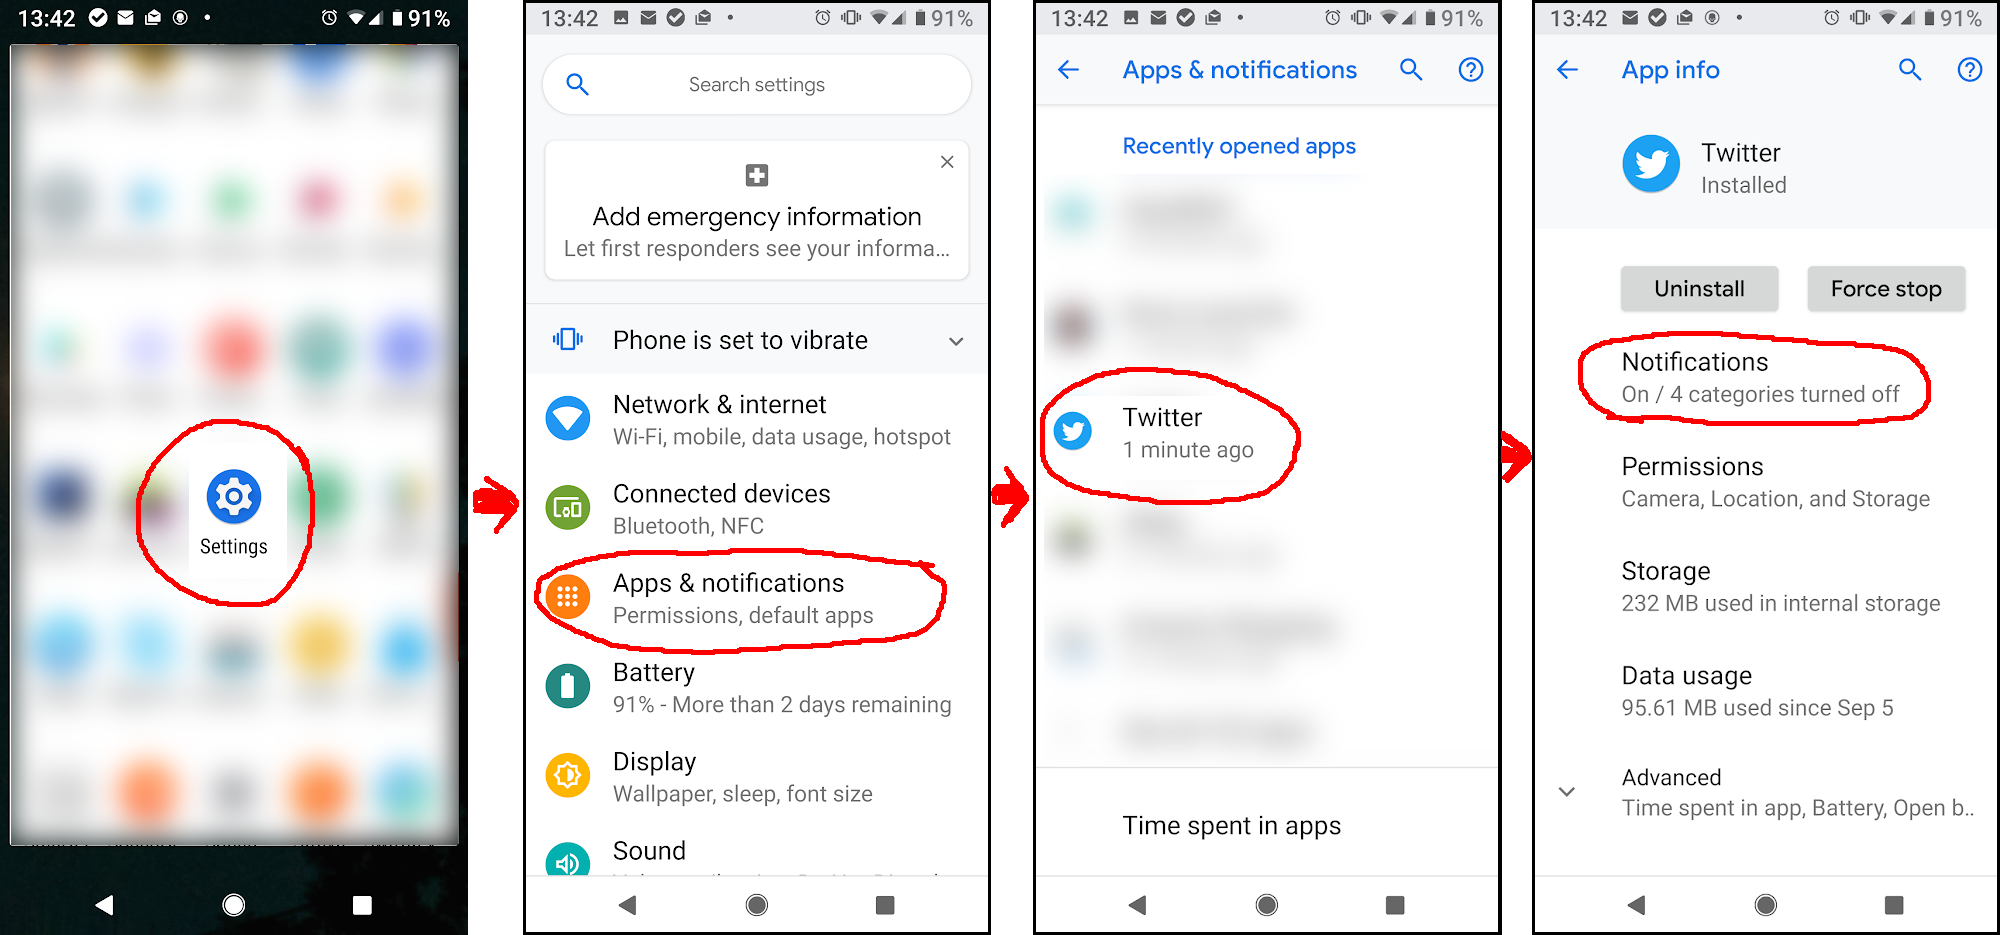
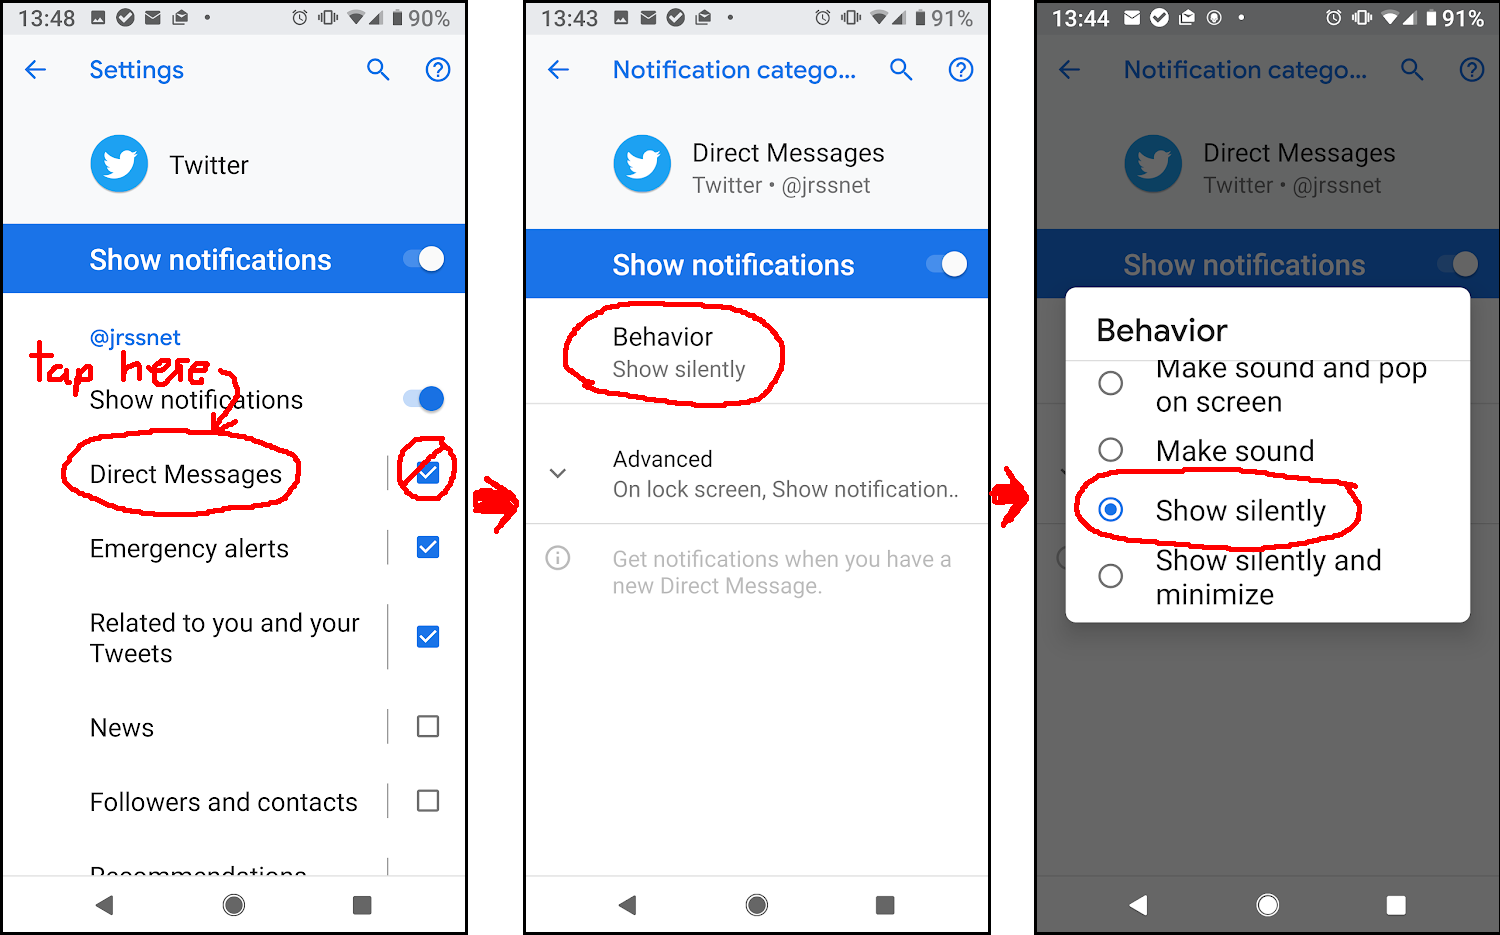
Now here’s the super crazy part. See all those checkboxes, to turn notifications on or off entirely for various events – Direct Messages, Emergency alerts, etc? Yeah, ignore the checkboxes, and tap the TEXT. Now tap “Behavior”, and set to “Show silently.” You will now continue to get notifications, but stop getting sounds and insanely-irritating vibrations, for each event type you change Behavior on.
Tap event category NAME (NOT checkbox!) –> Behavior –> Show silently
I’ve been suffering from over-vibrating apps, with Twitter being the absolute worst offender, for months. There still weren’t any vaguely decent how-tos today, but I finally pieced it together from vague clues on an androidcentral forum post.